

- Who this helps
- Itinerary designers, destination managers and tour-operation planners.
- What you can do
- Assess points of interest, check destination fit and build route variants with explicit access and disruption controls.
#Geography is a product decision
Article 03 identified opportunity areas worth investigating. Article 04 translated reviews into customer jobs and product requirements. Article 05 then prioritised English-speaking cultural city-break visitors as the Primary research segment, German-speaking repeat or short-break explorers as Secondary, and French-speaking cultural visitors as a Test segment. The next mistake would be to turn those findings directly into a list of famous sights.
Article 06 asks a harder question: where can an experience happen repeatedly, responsibly and with enough operational resilience to keep its promise? A place can be historically important and still be a poor operating stop. It may be too crowded, inaccessible, weather-exposed, sensitive for groups, poorly connected to toilets or recovery, or dependent on a timed ticket that makes the whole experience fragile.
The business decision is therefore not “which attractions should we include?” It is: which geography gives the strongest combination of relevance, storytelling value, accessibility, visitor dispersal, transport recovery, crowd tolerance and operating flexibility?
#Build the POI dataset before drawing the route
I built an 18-point POI evidence set across the Jordaan and western canal belt, Historic Centre, Oud-West, Museumplein, De Pijp, Plantage, Oosterdok, Amsterdam Oost, Noord and Westerpark. Each record contains coordinates, operating-hours summary, accessibility, rest/toilet support, public-transport context, crowding risk, neighbourhood sensitivity, dispersal value, weather exposure, storytelling value and attraction relevance.
The dataset deliberately mixes famous anchors with lower-pressure neighbourhood nodes. The goal is not to maximise the number of landmarks. It is to test whether a route can combine recognition with meaning, and whether that combination can survive rain, crowd peaks, mobility needs and transport disruption.
Coordinates are used as planning coordinates rather than turn-by-turn navigation instructions. Walking times in the route architecture are therefore operating estimates, not live-map guarantees. A field audit remains mandatory before commercial launch.
#What the scorecard measures
The Attraction Scorecard uses a transparent weighted screen rather than a subjective “must-see” ranking. Attraction relevance and storytelling value each receive 25%; accessibility and visitor-dispersal value receive 15% each; lower crowd risk receives 10%; lower neighbourhood sensitivity and lower weather exposure receive 5% each. The result is a route-design aid, not a claim about visitor demand.
This produces an important result: a famous attraction can score below a less famous node because the score includes the cost of operating there. The Anne Frank House has exceptional relevance and storytelling value, but the surrounding corridor has severe crowd and resident-sensitivity constraints and the historic house has substantial mobility limitations. The museum itself states that the building contains steep stairs and that the full historic route is not wheelchair accessible. It also requires time-specific online tickets. That makes it an important contextual anchor but a risky dependency for a general route. Anne Frank House accessibility.
The Rijksmuseum is the opposite kind of anchor: exceptionally high visitor recognition, strong indoor weather resilience, accessible toilets, lifts and seating, but also very high visitor intensity. The museum warns that parts such as the Gallery of Honour can become crowded. Rijksmuseum accessibility.
Nodes such as Eye Filmmuseum, De Hallen, Oosterpark and Westerpark become strategically interesting because they add different benefits: shelter, toilets, accessible infrastructure, contemporary storytelling and stronger visitor dispersal away from the most pressured central spaces.
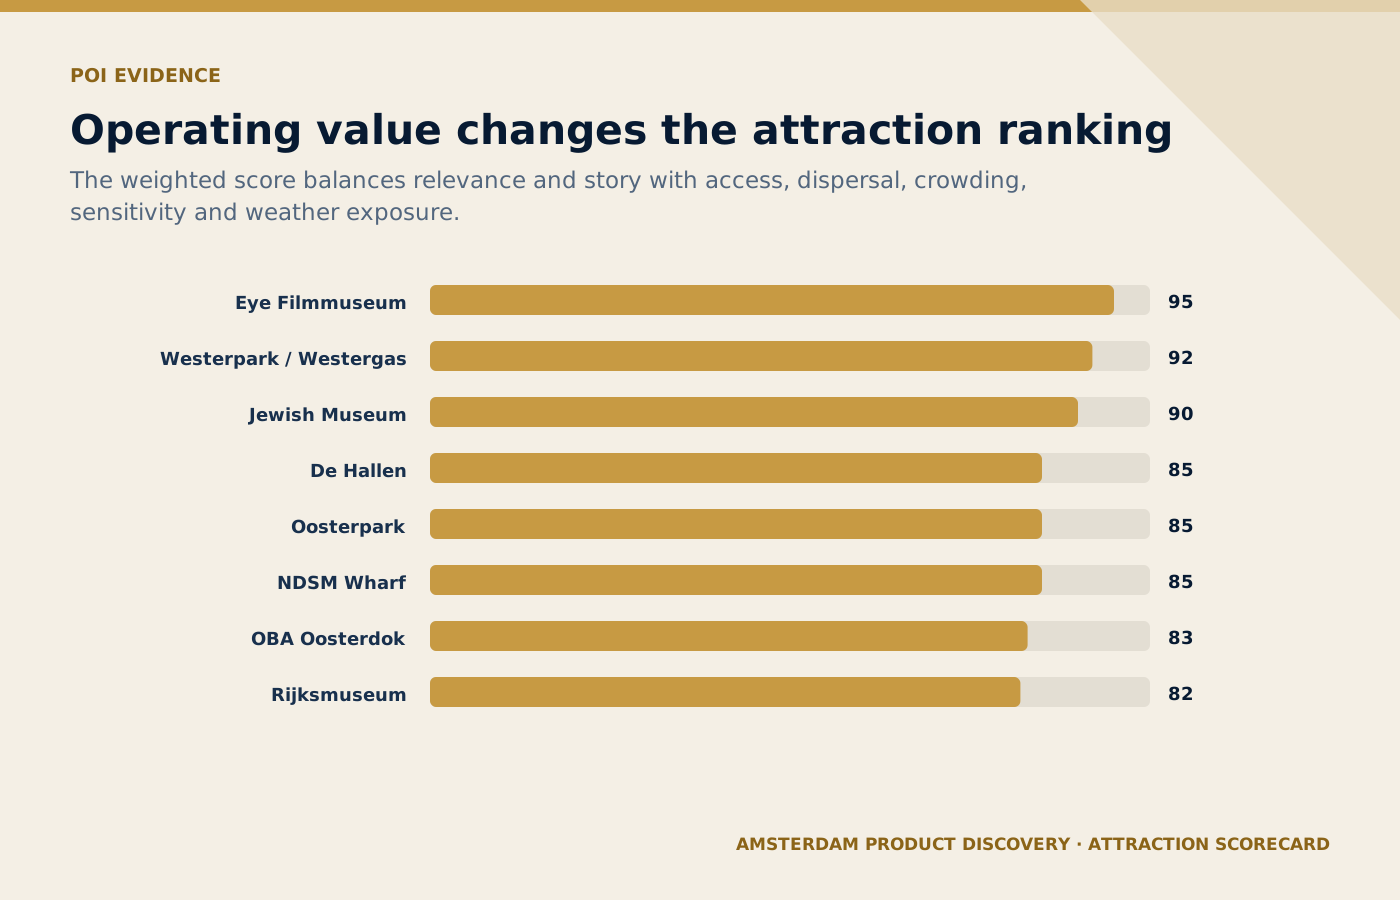
The scorecard changes a must-see ranking by including the operational cost and destination fit of each possible node.
On small screens, scroll the diagram horizontally to read its labels.
#Destination Fit Matrix
The POI score is not enough. Individual points need to work as a corridor. I therefore compared five candidate geographies: Jordaan/Western Canal Belt; Museumplein–De Pijp; Plantage–Oosterpark; Oosterdok–Noord; and Oud-West–Westerpark.
| Corridor | Best role | Destination fit | Main constraint |
|---|---|---|---|
| Jordaan / Western Canal Belt | Orientation + layered city history | CONDITIONAL | High crowd and resident sensitivity |
| Museumplein → De Pijp | Culture + food + everyday city | STRONG | Market/event crowd peaks and exposure |
| Plantage → Oosterpark | History + memory + green/east-city context | STRONG | Sensitive subject matter requires disciplined interpretation |
| Oosterdok → Noord | Waterfront + city transformation + contemporary Amsterdam | STRONG | Ferry and weather dependency |
| Oud-West → Westerpark | Neighbourhood life + regeneration + food/culture | STRONG | Less landmark recognition |
Scroll horizontally to read every column. Keyboard: focus the table, then use the arrow keys.
What to learn: Read each row across to connect Corridor with Best role, Destination fit, Main constraint. Compare the rows to identify the relevant corridor for your situation; use the accompanying section to interpret the result.
The matrix intentionally does not name a winner. Plantage–Oosterpark has an unusually good balance of story density, lower crowd pressure, transit and dispersal. Oosterdok–Noord is particularly strong for accessibility, modern Amsterdam and weather recovery. Museumplein–De Pijp has immediate visitor recognition and rich food/neighbourhood texture. Oud-West–Westerpark is operationally flexible but would need a proposition strong enough to overcome lower landmark salience. The Jordaan remains highly relevant, but it is the corridor most likely to fail a destination-responsibility test if treated as a conventional stop-and-talk tour.
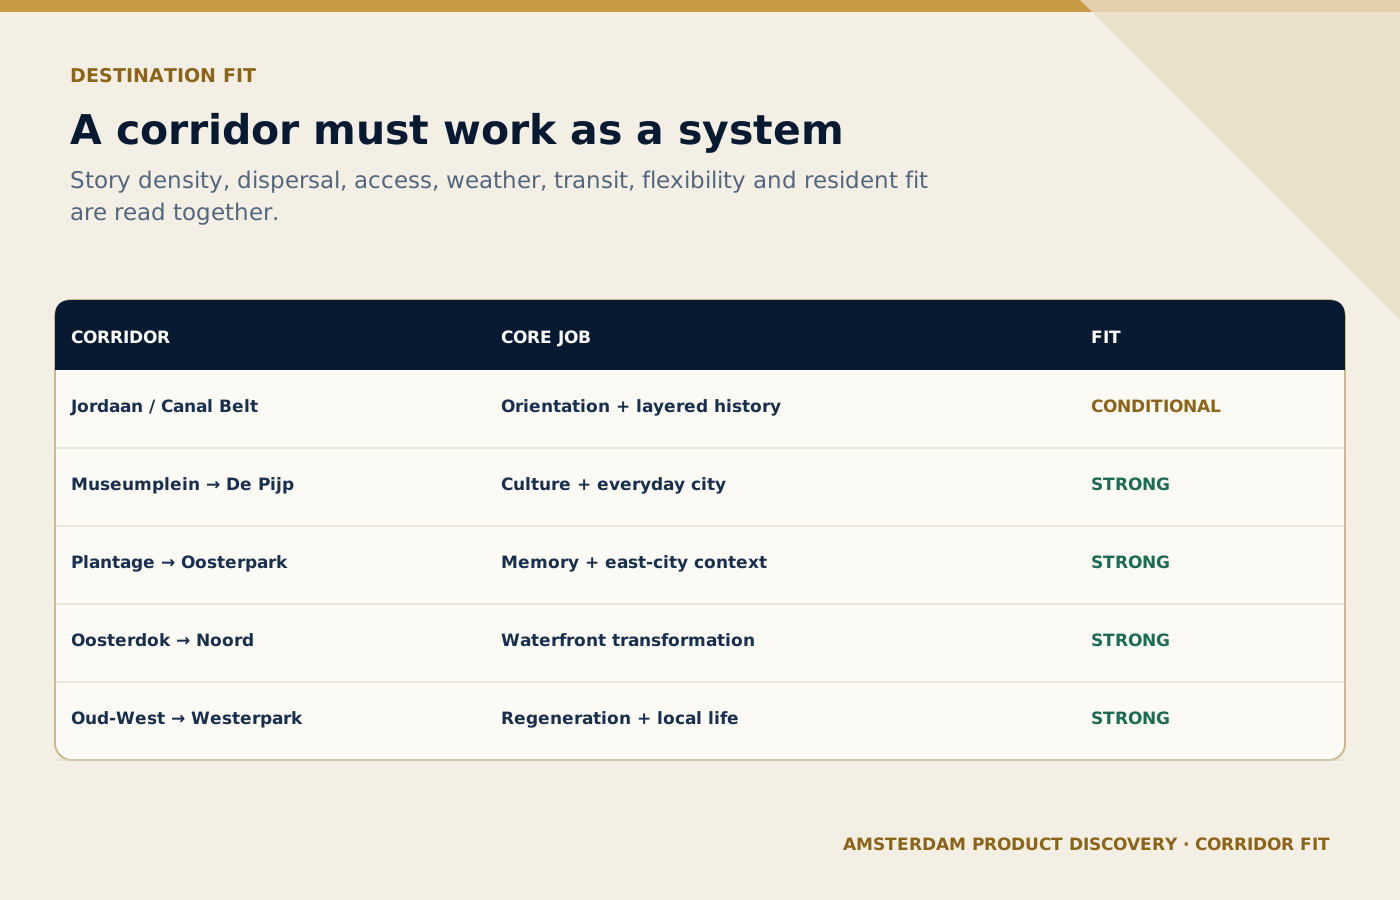
A corridor is assessed as a system across story, access, dispersal, weather, transit, flexibility and resident fit.
On small screens, scroll the diagram horizontally to read its labels.
#Crowding and neighbourhood sensitivity are design inputs
Amsterdam's guided-tour rules make this non-negotiable. In the city centre, groups may contain no more than 15 participants, and an exemption is required for groups above four. Tours must not pass sex workers' windows, must not stop on busy canal bridges or block shop entrances, and guides must explicitly ask participants to respect residents and businesses. City of Amsterdam guided-tour rules.
That changes route architecture. A high-value story does not automatically justify a fixed stop. In the western canal belt, some interpretation should be delivered while moving or from wider spaces outside peak flows. Quiet courtyards and residential streets should not become performance stages. In markets, the product must work with trading activity rather than treating stalls and residents as scenery.
Visitor dispersal is also not “send tourists somewhere else.” A neighbourhood only earns a high dispersal score when the visitor job, local story and operational infrastructure are genuinely strong enough to justify the visit.
#Accessibility is a route property, not a venue checkbox
Amsterdam's public transport network is extensive, but accessible journey planning is dynamic. GVB provides an accessibility option in its journey planner and publishes lift/escalator disruptions. That means an accessible route cannot be frozen as a static PDF and assumed to remain accessible. GVB step-free planning.
I amsterdam also warns that the city centre can be difficult because of narrow pavements, cobblestones and steep bridges. Accessibility on public transportation. A route that links two accessible museums can still be inaccessible between them.
Eye Filmmuseum is particularly useful as an accessibility and recovery anchor: its full building is wheelchair accessible, floors are connected by lifts, accessible facilities are available and the free IJ ferry creates a strong public-transport connection from Central Station. Eye visitor information. The Rijksmuseum similarly offers lifts, accessible toilets, mobility aids and seating, though the nearby Spiegelgracht stop has an accessibility caveat.
For that reason, the accessibility variant below is labelled candidate accessible architecture, not “fully accessible tour.” A physical route audit must still check surfaces, kerbs, bridge gradients, temporary works, station lifts and toilet access.
#Walking time, transport and recovery
Walking time is treated as a capacity constraint. Article 04 showed that physical-effort surprises can damage perceived value. The route therefore needs both a planned movement time and a recovery architecture: toilets, seating, shelter, hydration and an exit to public transport.
GVB's network covers tram, metro, bus and ferries. Most IJ ferries are free for pedestrians and cyclists. GVB network. But resilience matters more than theoretical coverage. GVB's 2026 summer timetable explicitly warns that works, events and diversions can increase travel times and recommends checking every journey immediately before departure. GVB disruption guidance.
The Anne Frank corridor illustrates why this must be stored in the dataset. The museum notes that no tram will run to Westermarkt from February 2025 through February 2028; visitors instead need to approach via Dam or other alternatives. A route document that merely says “tram to Westermarkt” would be operationally wrong.
#Five route variants
The route architecture is modular rather than a single fixed itinerary. Each version preserves the same customer job—understand Amsterdam through meaningful places with low planning friction—but changes geography or modules when conditions change.
#Normal: Plantage → Oosterpark cultural arc
Waterlooplein → Jewish Museum context → Hortus module → Oosterpark. Approximate movement distance: 3.2 km, around 45–55 minutes of pure walking before interpretation. This variant balances deep historical context, accessible transport, indoor recovery and visitor dispersal. It also avoids dependence on the most crowded central landmark corridor. Its main constraint is interpretation sensitivity: Jewish history, persecution and memory require source discipline and should never be reduced to entertainment.
#Peak crowd: Oud-West → Westerpark
De Hallen → Kinkerbuurt context → urban/industrial transition → Westerpark/Westergas. Around 3.8 km. This becomes the crowd-pressure fallback when the historic centre is operating beyond acceptable thresholds. It trades landmark recognition for neighbourhood texture, food/culture infrastructure and urban-regeneration storytelling. The product promise would need to explain why the route matters rather than selling it as “hidden gems.”
#Rain: Oosterdok → Noord sheltered route
OBA Oosterdok → Central Station passage → IJ ferry → Eye Filmmuseum. Around 2.1 km of walking plus the ferry. OBA and Eye create strong indoor recovery points with toilets and seating. The waterfront crossing still exposes guests to wind and rain, so this is not a fully indoor product. It is simply the most resilient candidate when prolonged rain would make parks and canal-side interpretation unpleasant.
#Accessibility: Oosterdok → Eye step-free architecture
This uses a similar geography but different operating logic: every movement decision is checked through the GVB accessibility planner; live lift status becomes a go/no-go condition; rest intervals are shorter; and accessible toilets are planned rather than discovered. The route remains provisional until a mobility-focused field audit confirms kerbs, surfaces, gradients and station transitions.
#Disruption: Museumplein → De Pijp modular fallback
Rijksmuseum exterior/arcade → Museumplein → Albert Cuyp edge → Sarphatipark. Around 2.7 km. This corridor offers multiple transit exits and enough alternative content to remove one blocked street or unavailable venue without destroying the experience. During heavy market congestion, the Albert Cuyp module can be replaced by a side-street/neighbourhood module while preserving the same culture-and-everyday-city job.
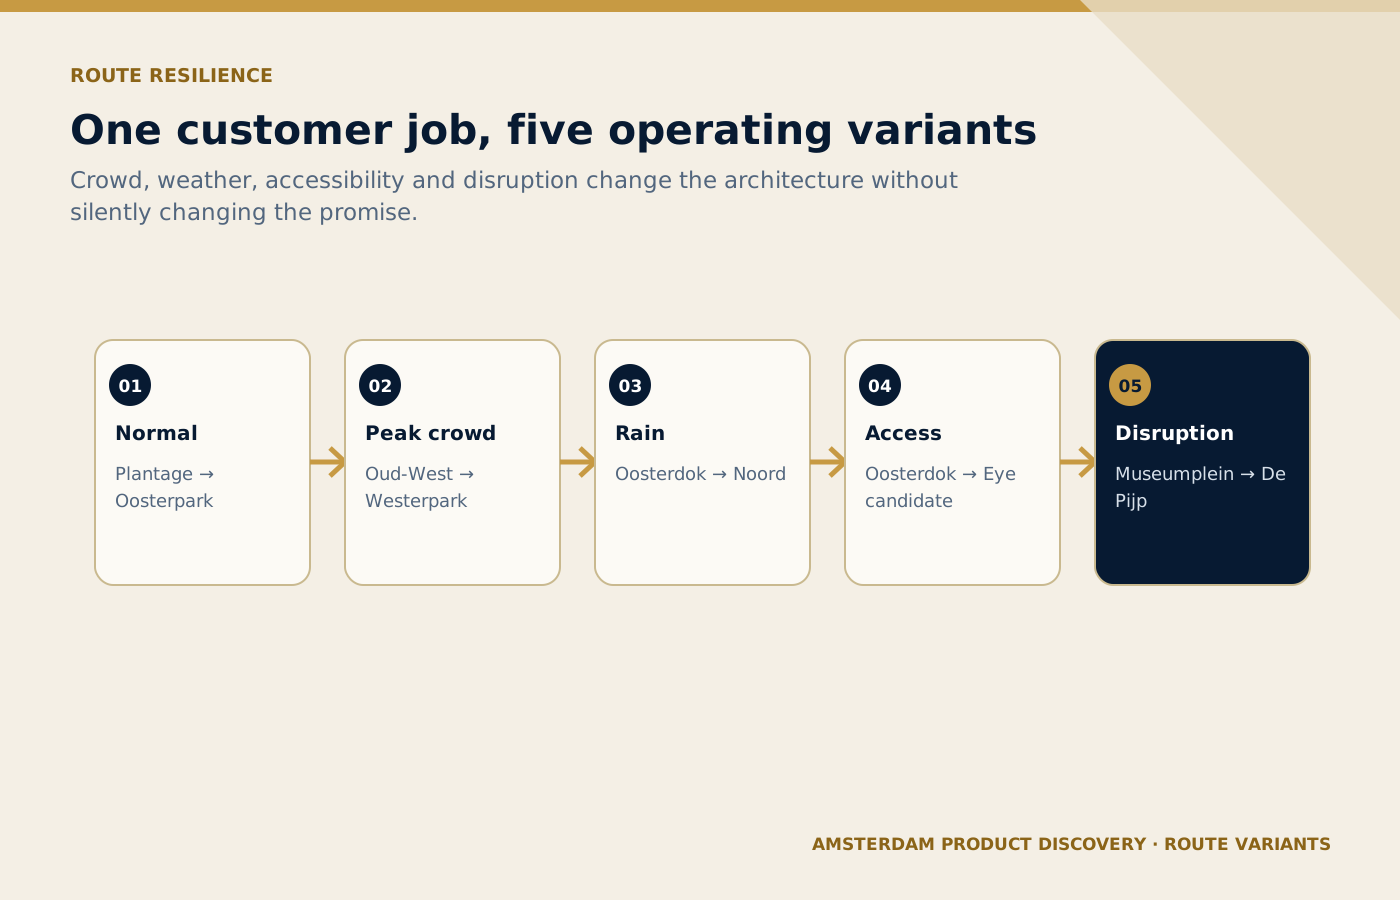
Each operating variant changes the path while preserving the same customer job and product promise.
On small screens, scroll the diagram horizontally to read its labels.
#Route Architecture: six modules, not a chain of sights
The Route Architecture contains six reusable modules.
- Anchor: a recognisable reason to care.
- Context: two or three interpretation moments that turn place into meaning.
- Local texture: one less-obvious neighbourhood, market, park or urban-regeneration element that earns its place through story value.
- Recovery: a planned toilet, seating, shelter, hydration or transit opportunity.
- Flex: a pre-approved substitute stop or shortened sequence that protects the product promise during disruption.
- Exit: a finish close to reliable public transport plus onward recommendations.
This architecture is more useful than a single route line because it makes failure visible. If a route has no recovery module, it is fragile. If its anchor is the only reason to buy, it is vulnerable to closure. If its “local discovery” module exists only because the street photographs well, it fails the Article 04 requirement for meaningful context.
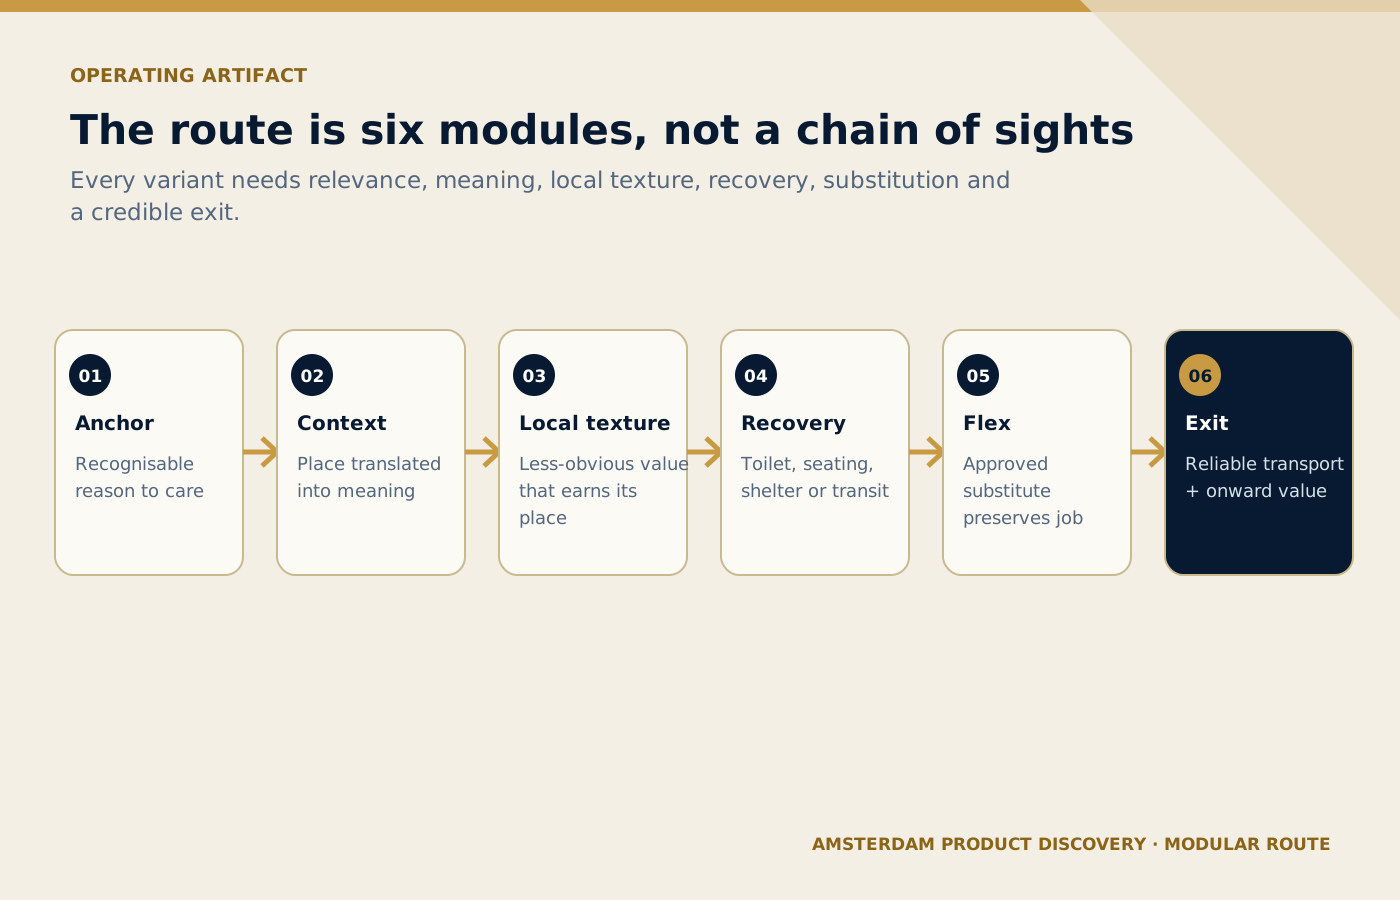
The module architecture exposes missing recovery, substitution and exit controls before a route is field tested.
On small screens, scroll the diagram horizontally to read its labels.
#Storytelling value versus attraction relevance
Article 06 keeps these variables separate. Attraction relevance asks whether a visitor is likely to understand why the place matters. Storytelling value asks whether the location can support a coherent, evidence-backed narrative that advances the customer job.
Oosterpark is a useful example. It is not an Amsterdam icon in the way the Rijksmuseum is, but its memorials, neighbourhood context and relationship to Amsterdam Oost can support migration, colonial, social and civic stories while also creating visitor dispersal. Eye does something similar for waterfront transformation, architecture, cinema and the shift from historic harbour city to contemporary creative city.
Conversely, a photogenic canal bridge may be highly relevant visually but have poor operating value if the group cannot legally or responsibly stop there.
#Rest, toilets and weather are part of the product promise
Toilets and rest points are treated as infrastructure, not incidental amenities. Indoor anchors—Rijksmuseum, Jewish Museum, Eye, De Hallen, NEMO and OBA—score well because they can support recovery, shelter and route resilience. Parks and open markets score lower on weather resilience even when their storytelling value is strong.
This matters seasonally. Amsterdam does not need a different product concept every time it rains, but it does need a different operating pattern. The rain architecture shortens exposed interpretation and increases indoor modules. The peak-crowd architecture shifts geography. The accessibility architecture changes movement assumptions. The disruption architecture protects the customer promise when one node disappears.
#What this evidence does—and does not—validate
Observed facts: venue hours and accessibility claims; City of Amsterdam group rules; public-transport network and disruption guidance; published coordinates and location evidence.
Derived metrics: POI scores, destination-fit ratings, approximate route lengths and movement-time estimates, and the crowd/weather/resilience classifications.
Hypotheses: that a lower-pressure east/west/noord corridor can deliver equal or better visitor value than a landmark-dense centre route; that modular recovery improves perceived quality; and that repeat visitors may respond better to neighbourhood depth than basic highlight coverage.
Assumptions: that field conditions broadly match public evidence; that accessible public transport can be operationally relied upon after same-day checks; and that commercial partners/venues will permit the intended use where entry or hospitality is involved.
Nothing in Article 06 validates willingness to pay, final language, final duration, guide staffing cost or the final experience format. Those decisions belong later in the series.
#Visualization rationale
The Attraction Scorecard is a ranked table because the management question is comparative. The Destination Fit Matrix is a corridor matrix because geography creates trade-offs across multiple dimensions. The Route Architecture is drawn as modules and variants rather than a tourist map because the key insight is operational substitutability: the route must still work when weather, crowds or access conditions change.
#Copy-ready AI prompts
PROMPT 01 — ROUTE STRESS TEST
You are reviewing an Amsterdam tourism route. Use only the supplied POI dataset and route architecture. For each route module, identify the failure mode if crowding, rain, lift outage, venue closure or street works occur. Do not invent alternative venues. Return: risk, affected customer job, approved fallback, residual risk and evidence gap.
PROMPT 02 — ACCESSIBILITY AUDIT PREP
Using the approved Article 06 POI and transit evidence, create a field-audit checklist for a mobility-focused route test. Separate public-source claims from items that must be physically verified: kerbs, surface quality, bridge gradient, door width, seating interval, toilet path, lift dependency and emergency exit.PROMPT 03 — STORY DENSITY CHECK
Review the proposed route stops. For each stop, classify it as ANCHOR, CONTEXT, LOCAL TEXTURE, RECOVERY, FLEX or EXIT. Flag any stop that is present mainly because it is famous or photogenic but does not advance a defined visitor job. Do not add new stops.#Management conclusion
The geographic evidence changes the shape of the product problem. The strongest route is unlikely to be the route with the most famous attractions. A more resilient experience is likely to combine one recognisable anchor with deep interpretation, lower-pressure local texture, planned recovery and a credible substitute path.
Article 06 therefore leaves multiple geography options alive. Plantage–Oosterpark, Oosterdok–Noord, Museumplein–De Pijp and Oud-West–Westerpark all remain viable candidate corridors. The Jordaan/Western Canal Belt remains useful for context and orientation but should be treated as conditional because of crowd and neighbourhood sensitivity.
The next phase may use these corridors as inputs to product-requirement and concept work, but Article 06 does not select the final route, format or language.
#Research artifacts
- Verified POI dataset
- Attraction Scorecard
- Destination Fit Matrix
- Five route variants
- Route module architecture
- Transit and accessibility evidence
- Destination-responsibility register
- City of Amsterdam — guided-tour rules
- GVB — step-free access
- I amsterdam — accessible public transport
Connect this guide to your next step
Continue with related methods and the wider series.
- Series guideBuilding a Data-Driven Signature Tour.
Explore the complete series and its reading order.
- Related guideWho Should We Build It For? Source Markets, Segmentation, Language and Customer Jobs
Part 05 of a 12-part Amsterdam tourism product-management case study: source-market segmentation, language supply, connectivity and guide feasibility translated into Primary, Secondary and Test research segments.
- Related guideCan We Operate It Responsibly? Regulation, Accessibility, Sustainability and Product Risk
Part 09 of a 12-part Amsterdam tourism product-management case study: verified regulation, product risk, accessibility controls and measurable destination responsibility for Amsterdam Layers.
Put this article into practice
- Check route geography, access and travel-time assumptions.
- Record destination constraints and accessibility evidence.
- Keep attraction facts separate from untested route promises.
- Assign an owner to verify the proposed journey in the field.
Your next step
Carry the verified findings, assumptions and open questions into the next research stage.
Continue to Amsterdam Product Requirements and Signature Concept