

- Who this helps
- Product managers, analytics teams and commercial decision-makers.
- What you can do
- Define governed measures, review a frozen performance snapshot and connect improvement actions to an evidence-led product decision.
A product does not become successful because the pilot team liked delivering it. It becomes decision-ready when acquisition, bookings, attendance, customer value, operational reliability, contribution and destination impact can be compared with thresholds that were fixed before the first guest arrived.
Article 11 designed that pilot for Amsterdam Layers — Context & Neighbourhood Discovery. Article 12 is where the project is supposed to confront the results. There is one problem that cannot be solved with a dashboard: the current project package contains no real Amsterdam Layers pilot departures.
There is no governed booking ledger, attendance file, realised contribution record, cancellation history, Amsterdam Layers rating set, incident log or completed Article 11 experiment outcome. The Article 08 commercial values are scenarios. The Article 04 reviews describe competitor/customer evidence. The Article 09 risks are prospective controls. None of those may be relabelled as post-pilot performance.
So this final article does two things. First, it builds the measurement and improvement system required to evaluate the product when real operational data exists. Second, it makes the only defensible decision available from the current evidence state: ITERATE — complete the controlled pilot and return to the frozen scorecard before any scale claim.
#The business decision
The decision is not “did guests enjoy Amsterdam?” It is whether this specific product, at its approved eight-guest service ceiling, can repeatedly create customer value, positive contribution, reliable operations and acceptable destination impact.
The final decision vocabulary is deliberately narrow:
- SCALE — evidence supports repeatable growth without breaking service, economics, compliance or destination controls.
- ITERATE — the core concept remains plausible, but material evidence or performance gaps require another controlled cycle.
- REPOSITION — the operating capability may work, but the target customer, promise, channel, geography or value proposition needs material change.
- STOP — evidence shows that continuing would not be justified.
These are product decisions, not emotional labels. A weak pilot can still be valuable if it tells the team exactly what not to scale.
#First question: does post-pilot data actually exist?
The first analytical control is a data-existence test. The current repository contains the Article 11 Pilot Plan, 15 success thresholds, 12 planned experiments, RACI, launch-readiness checklist and Daily Operations Pack. It does not contain a completed departure dataset.
The new article12-pilot-data-status.csv therefore marks
bookings, attendance, cancellations, no-shows, realised contribution,
pilot ratings, incidents and experiment outcomes as
AWAITING. This is not a failure of analysis. It is
provenance discipline.
A blank actual result is more useful than a fabricated 4.8/5 rating, 80% load factor or €60 contribution. Invented pilot performance would contaminate every later decision.
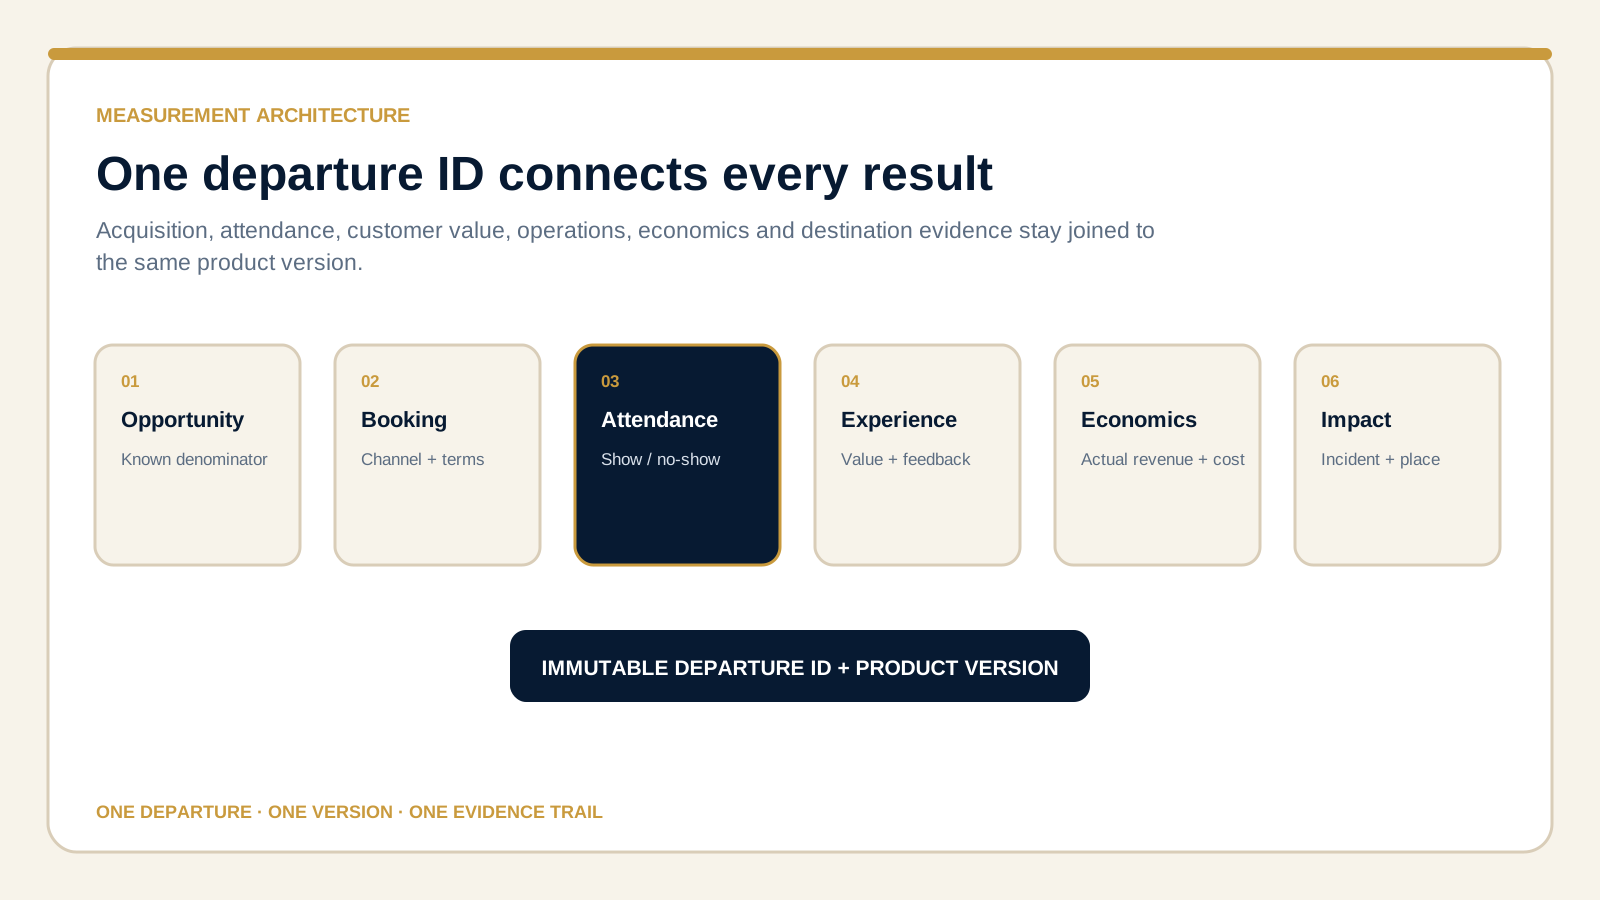
One immutable departure ID prevents customer, operational and commercial evidence from different tours being presented as one result.
On small screens, scroll the diagram horizontally to read its labels.
#Build one departure-level source of truth
One departure ID connects funnel, service, commercial and VOC evidence.
Article 12 creates a departure-performance schema so customer, operational and commercial evidence can be joined without mixing different tours. Every real departure receives one immutable departure ID and records the product/SOP version used.
At minimum, the record connects date, planned and actual start/finish times, route variant, Green/Amber/Red state, capacity, bookings, attendance, cancellations, no-shows and distribution channel. Paid departures add realised revenue, refunds, commission/payment fees, actual guide cost, other departure costs and allocated fixed cost. Customer evidence adds context usefulness, recall, interaction, effort-expectation accuracy, rating and complaint themes. Operational evidence adds route completion, incidents, resident/public-space events and route-switch outcomes.
That architecture prevents a common analytics error: reporting a customer score from one departure beside margin from another and presenting both as one product result.
#The funnel: acquisition is not a booking
The acquisition funnel should run:
Eligible opportunity → booking → attendance → feedback → repeat/referral signal
But a funnel is only valid when its denominator is known. OTA page views, social impressions and general website traffic should not automatically become “qualified leads.” Article 11 experiment E07 requires source-tagged recruitment, while E11 requires comparable weekday/weekend opportunity cells where feasible.
When those denominators exist, Article 12 will report booking conversion by channel and cell. Until then, conversion remains not evaluable. The framework also separates cancellation from no-show because they represent different operational and commercial problems.
#Capacity: protect the service ceiling
Article 07 fixed eight guests as the maximum pilot service capacity. Article 08 showed why that ceiling creates commercial pressure. Article 11 therefore asked the pilot to observe interaction quality across naturally occurring occupancy bands of 4–5, 6 and 7–8 guests.
The final analytics must show booked guests, attended guests and load factor together. A departure can be commercially full but operationally weak if interaction deteriorates. Equally, a five-person departure can receive excellent feedback while losing money.
The scale decision must therefore resist the temptation to optimise one metric. Capacity is a joint customer-value and unit-economics variable.
#Commercial performance: realised economics replace scenarios
Article 08 used a €55 test midpoint, €200 assumed guide cost and channel assumptions to expose the commercial problem. Those values were never contracted facts. Article 12 replaces them with realised data.
For every paid departure:
Net revenue = realised gross revenue − refunds − commission/payment fees
Contribution = net revenue − actual variable costs − actual departure costs − allocated fixed cost
Contribution margin = contribution ÷ net revenue
Research-funded departures remain visible but are excluded from recurring commercial validation. A subsidised pilot may answer a customer question; it cannot prove the product makes money.
The Article 11 commercial threshold remains frozen: recurring paid operation must show non-negative contribution without requiring more than eight guests. Actual supplier and channel cost capture must be complete for every paid departure used in that conclusion.
#Punctuality and duration variance reveal process quality
The Daily Operations Pack already requires planned and actual operating times. Article 12 turns those into two basic process measures: on-time start and duration variance.
The planned duration remains 110–135 minutes, with 122.5 minutes used only as the midpoint for descriptive variance. A tour finishing at 145 minutes is not automatically a defect. The reason matters: customer questions, a route disruption, slow mobility, guide pacing or an unapproved content expansion have different implications.
Variance analysis should therefore pair the number with a reason code. Repeated controllable overruns may justify root-cause analysis; one weather-related deviation may simply demonstrate that the recovery process worked.
#Customer value: rating is not the whole product
The Article 11 thresholds are more demanding than a star rating. The pilot must test whether guests find the context useful, remember the three-layer interpretation structure, feel the physical effort matched the promise and experience enough interaction.
The frozen targets include context usefulness of at least 4.5/5, recall of at least 80%, physical-effort expectation accuracy of at least 90%, interaction quality of at least 4.5/5 with question participation of at least 80%, and feedback response of at least 70%.
When ratings eventually exist, Article 12 should show the distribution and sample size rather than hiding everything behind a mean. Review text should be coded back to the governed Article 04 taxonomy so the project can distinguish interpretation depth, local discovery, navigation, pace, value, group interaction and other recurring themes.
#Pareto only when there is something to rank
Pareto analysis is useful when repeated complaints or defects accumulate under consistent coding. It is not useful when the pilot has zero complaints or two unrelated issues.
When enough events exist, the analysis can rank pain points by frequency or impact and calculate cumulative contribution. That may reveal, for example, that most recoverable dissatisfaction comes from arrival instructions and effort expectation rather than the storytelling itself. But Article 12 will not pre-write that result.
#Cohorts: compare like with like
Cohort analysis becomes useful once there are enough observations to compare meaningful groups: Direct versus OTA/B2B, weekday versus weekend opportunity cells, occupancy bands, route variants, or possibly language research cells.
Every cohort output must show n. A 100% conversion rate from one eligible prospect is not evidence that one channel is superior. The pilot is intentionally small, so Article 12 prioritises descriptive differences and confidence limits over false precision.
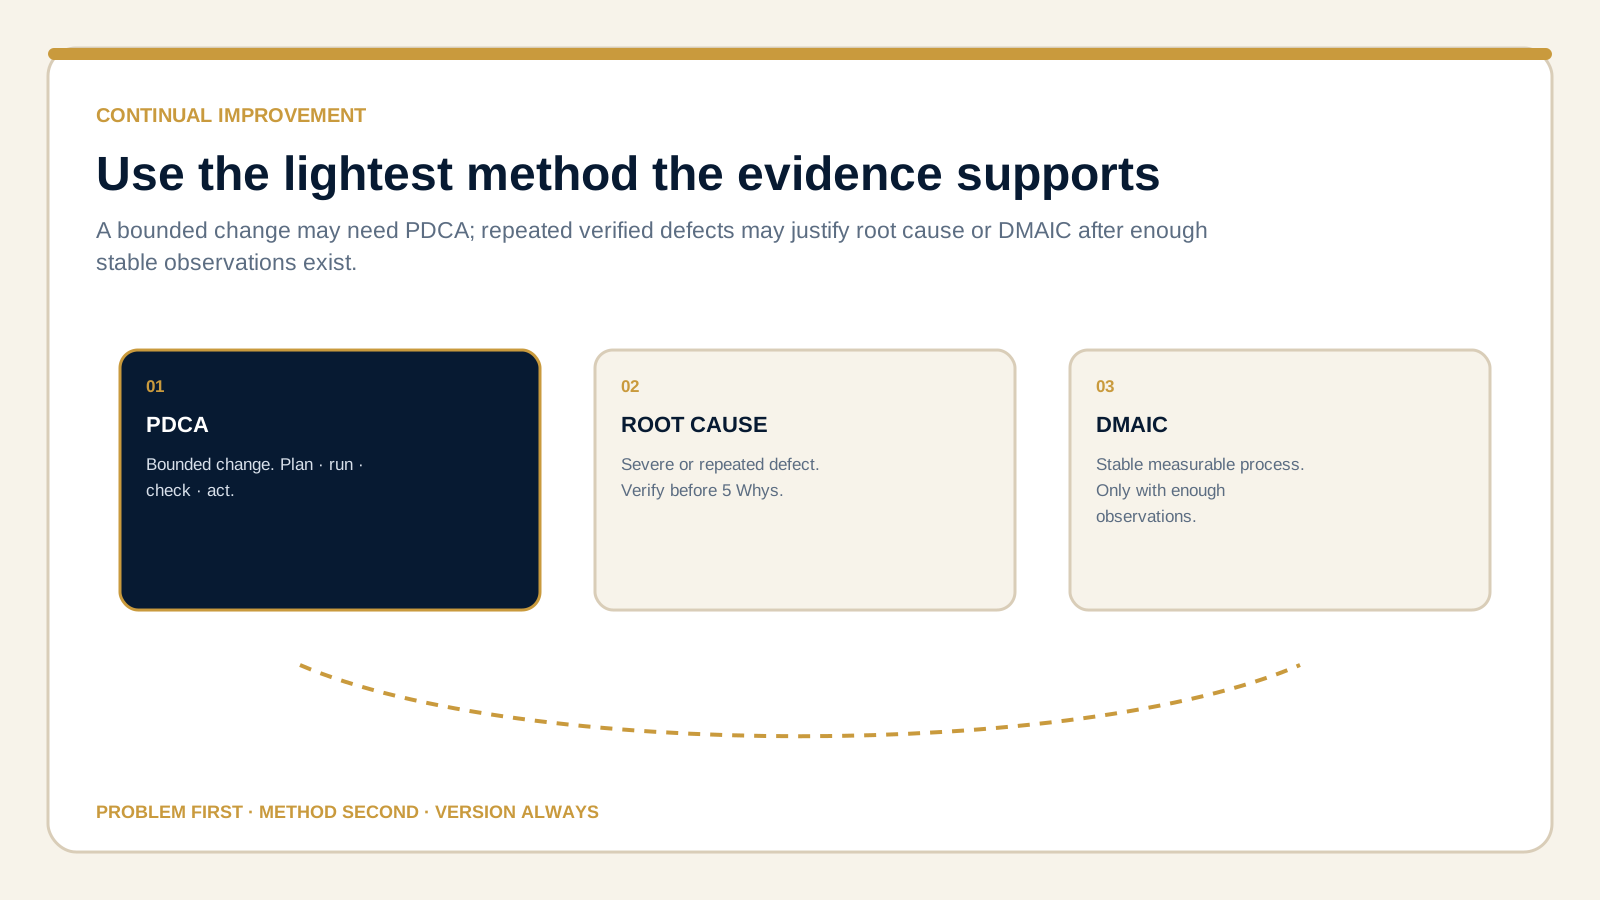
The verified problem and available evidence determine the method; version history keeps every approved change traceable.
On small screens, scroll the diagram horizontally to read its labels.
#Root cause, PDCA and DMAIC: use the lightest method that fits
Use the lightest justified improvement method and preserve product-version history.
Not every problem needs a formal methodology. A bounded content or operations change can use PDCA: plan the change, run it, check the result, act on what was learned, and preserve the version history.
Root-cause analysis is justified for a severe incident, repeated defect or material threshold failure. The problem statement must be verified before using 5 Whys or a fishbone diagram.
DMAIC is reserved for a repeated, measurable process problem with enough observations to justify a structured improvement project. Applying full DMAIC to six heterogeneous pilot departures would create process theatre rather than insight.
#Control charts are not decoration
A control chart requires a stable repeated process and enough sequential observations to estimate meaningful control limits. The planned six paid pilot departures are not automatically sufficient.
Article 12 therefore marks control charts NOT JUSTIFIED YET. Early performance can be shown as a simple run chart with the target line and annotations for route, weather or product-version changes. If later operation becomes stable and repeated, a control chart can be introduced with an appropriate chart type and documented assumptions.
#Performance Review: compare against Article 11, not against memory
The new Performance Review copies all 15 Article 11 success thresholds into a post-pilot evaluation table. The threshold text is preserved. The actual-result and sample-size fields remain empty, and every row is marked AWAITING_REAL_OPERATIONAL_DATA.
This prevents retrospective target editing. If context usefulness eventually scores 4.3/5, the team cannot quietly lower the target from 4.5/5 after seeing the result. It can decide that the threshold was inappropriate, but that change must be documented as a new version and cannot rewrite the original pilot decision.
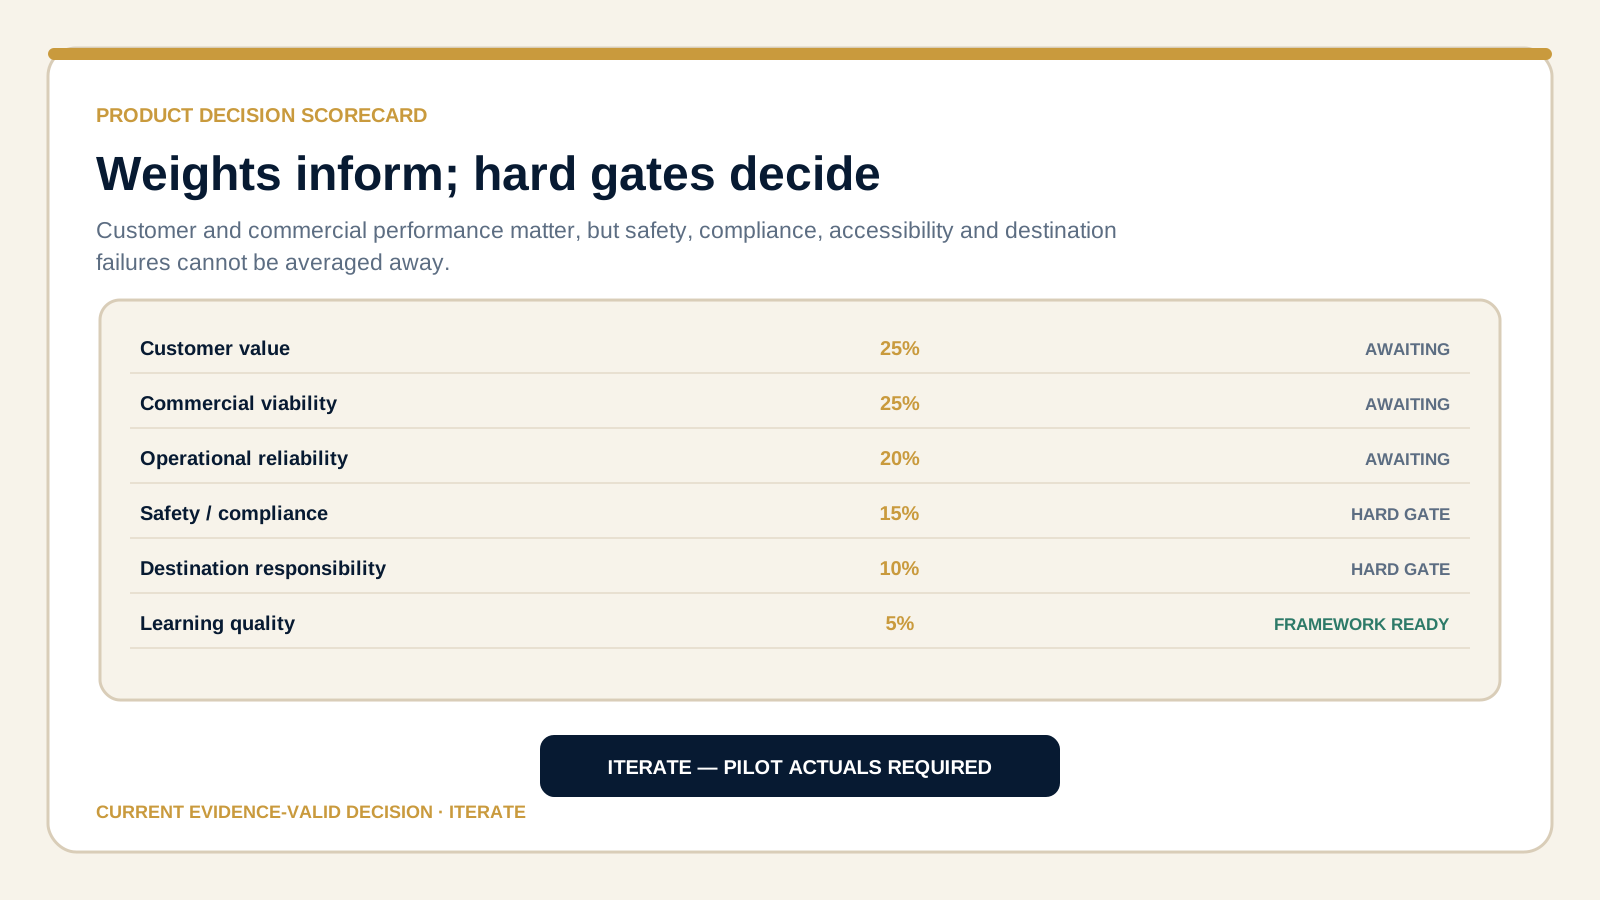
Weights make the review transparent, but safety, compliance, accessibility, commercial and destination gates cannot be averaged away.
On small screens, scroll the diagram horizontally to read its labels.
#How the Product Decision Scorecard works
Weights create transparency; hard safety, compliance and commercial gates cannot be averaged away.
The final scorecard uses six dimensions:
- Customer value — 25%
- Commercial viability — 25%
- Operational reliability — 20%
- Safety, compliance and accessibility — 15%
- Destination responsibility — 10%
- Learning quality — 5%
The weights create transparency, but the score cannot override a hard gate. A severe preventable safety incident cannot be averaged away by excellent ratings. A product with negative recurring contribution cannot become scalable because guests liked it. Likewise, profitable operation does not excuse material resident impact or non-compliance.
Because real pilot outcomes do not exist, the numeric score cells are intentionally blank. Five of the six dimensions are not evaluable. Learning quality receives only a framework-readiness status because the measurement system now exists.
#What would justify SCALE?
SCALE requires more than six happy departures. At minimum, the must-pass safety/compliance/accessibility controls need to hold; customer-value thresholds need to be met with disclosed response rates; recurring economics need to be positive using actual costs; route and variant reliability need to be acceptable; destination-impact controls need to hold; and the evidence must be complete enough to reproduce the conclusion.
Even then, “scale” should mean the next controlled capacity or frequency step, not immediate mass expansion. The eight-guest service ceiling remains protected unless a later experiment demonstrates that changing it preserves the product promise and economics.
#When ITERATE, REPOSITION or STOP?
ITERATE fits when the core customer job and concept remain plausible but execution, evidence or one or more thresholds require a bounded change and retest.
REPOSITION fits when the capability works but the original market framing does not — for example, if guests value the interpretation but the chosen segment, language, route, channel or price architecture consistently fails.
STOP fits when a critical condition cannot be made acceptable: unsafe operation, unresolved compliance, persistent negative economics without a credible remedy, unacceptable destination impact, or weak customer value after reasonable iteration.
#The current evidence state
The project has done substantial pre-pilot work: competitive evidence is frozen, VOC and segmentation are governed, geography and concept requirements are traced, unit economics are modelled, legal/accessibility/sustainability controls are defined, the operating calendar exists, and the pilot system has thresholds and experiments.
But Article 11 ended with PUBLIC PAID PILOT NOT YET AUTHORISED because guide terms, permit position, insurance, booking implementation and route/accessibility field validation remained open. No later file in the current package shows those blockers closing or real guests being operated.
Therefore Article 12 cannot honestly evaluate product performance. It can only evaluate the current decision readiness.
#Final Product Decision Scorecard
Customer value: awaiting Amsterdam Layers pilot evidence.
Commercial viability: awaiting realised price, cost, channel and contribution evidence.
Operational reliability: awaiting real departure timing, completion, switch and incident evidence.
Safety/compliance/accessibility: pre-launch controls defined; real-operation performance still awaiting evidence.
Destination responsibility: awaiting actual stakeholder/public-space and departure evidence.
Learning quality: measurement framework ready; experiments not yet executed.
#Human + AI post-pilot review prompts
These prompts structure evidence review without manufacturing missing results. A named human decision owner approves every product and improvement decision.
#Audit the departure dataset before analysis
When to use it
Determine whether the post-pilot dataset is complete and comparable enough for a product decision.
Required inputs
[Paste the departure schema, booking ledger, attendance, realised economics, customer feedback, incidents, experiment outcomes and product-version log.]
Complete prompt
ROLE
Act as a tourism product analytics reviewer.

DECISION/TASK
Determine whether the post-pilot dataset is complete and comparable enough for a product decision.

INPUT
[Paste the departure schema, booking ledger, attendance, realised economics, customer feedback, incidents, experiment outcomes and product-version log.]

METHOD
Test join keys, denominators, missingness, sample size, version consistency and separation of research-funded versus recurring paid departures.

CONSTRAINTS
Do not fill missing actuals, infer private performance or combine evidence from different departures. Show where a conclusion is not evaluable.

OUTPUT
Return usable fields, missing evidence, comparability risks, affected thresholds, accountable owner and the next data-control action.
Expected output
Return usable fields, missing evidence, comparability risks, affected thresholds, accountable owner and the next data-control action.
Human verification
Check every finding against the supplied records and original sources. Verify calculations, assumptions and missing evidence. The accountable human owner approves any operational decision or publication.
#Run the governed product decision review
When to use it
Recommend SCALE, ITERATE, REPOSITION or STOP against the frozen Article 11 thresholds.
Required inputs
[Paste validated departure actuals, Performance Review, Product Decision Scorecard, incidents, destination evidence, commercial actuals and open changes.]
Complete prompt
ROLE
Act as a tourism product review board analyst.

DECISION/TASK
Recommend SCALE, ITERATE, REPOSITION or STOP against the frozen Article 11 thresholds.

INPUT
[Paste validated departure actuals, Performance Review, Product Decision Scorecard, incidents, destination evidence, commercial actuals and open changes.]

METHOD
Compare each actual with its original threshold and disclosed sample size. Apply hard safety, compliance, accessibility, commercial and destination gates before weighted scoring.

CONSTRAINTS
Do not average away a hard-gate failure, change thresholds retrospectively or treat directional evidence as validation. State uncertainty and dissent.

OUTPUT
Return the decision, gate evidence, dimension results, unresolved risks, approved corrective actions, owner, timing and the evidence required for the next review.
Expected output
Return the decision, gate evidence, dimension results, unresolved risks, approved corrective actions, owner, timing and the evidence required for the next review.
Human verification
Check every finding against the supplied records and original sources. Verify calculations, assumptions and missing evidence. The accountable human owner approves any operational decision or publication.
Final decision gate: ITERATE — complete the controlled pilot and populate the frozen review before any scale claim.
#Final decision
ITERATE
This is not a negative verdict on Amsterdam Layers. It is the only evidence-valid decision while real pilot performance is absent. The next iteration is not another conceptual article. It is to close the Article 11 blockers, run the controlled pilot, freeze the departure-level dataset, populate the Performance Review without changing the original thresholds, and then rerun this Product Decision Scorecard.
Only real operational evidence can move the project from ITERATE to SCALE, REPOSITION or STOP.
Connect this guide to your next step
Continue with related methods and the wider series.
- Series guideBuilding a Data-Driven Signature Tour.
Explore the complete series and its reading order.
- Related guideWill the Product Make Money? Pricing, Distribution, Capacity and Tourism Unit Economics
Part 08 of a 12-part Amsterdam tourism product-management case study: transparent pricing, channel economics, capacity, break-even and commercial guardrails without invented private sales data.
- Related guideWhat Visitors Really Want: Mining Amsterdam Reviews and Voice of Customer
Part 04 of a 12-part Amsterdam tourism product-management case study: human-first review coding, AI-assisted VOC classification, independent validation, JTBD, Pareto and traceable product requirements.
Put this article into practice
- Audit the departure dataset before interpreting performance.
- Keep metric definitions and observation periods consistent.
- Compare evidence against the approved scale criteria.
- Record the scale, revise or stop decision and its accountable owner.
Your next step
Supply the required inputs, copy the complete prompt and verify the output before using it in the operation.
Apply the complete research prompt