

- Who this helps
- Tourism product managers and destination strategy teams.
- What you can do
- Combine supply, demand, policy and feasibility evidence in an opportunity model that makes assumptions and uncertainty visible.
A market gap is not the empty space between two OTA listings. It exists only when a meaningful visitor job, a defensible way to serve it, workable economics and a positive destination contribution overlap.
#The business decision: find a testable opportunity, not a winning tour
Article 02 froze the supply-side evidence at 84 FULL marketplace observations representing 78 reconciled product families. That gives this article a much stronger starting point than a search page, but it still does not tell us what to build. Public supply can show category density, positioning, disclosed features, duration, language, group model, review counts and a narrow set of comparable prices. It cannot reveal private bookings, conversion, contribution margin, customer satisfaction drivers or an unmet need.
Article 03 therefore asks a different management question: is there enough triangulated evidence to justify deeper customer research, and where should that research concentrate? The decision is deliberately one level below concept selection. A high opportunity score means “investigate this problem space,” not “build this product.” Article 04 remains responsible for voice-of-customer evidence.
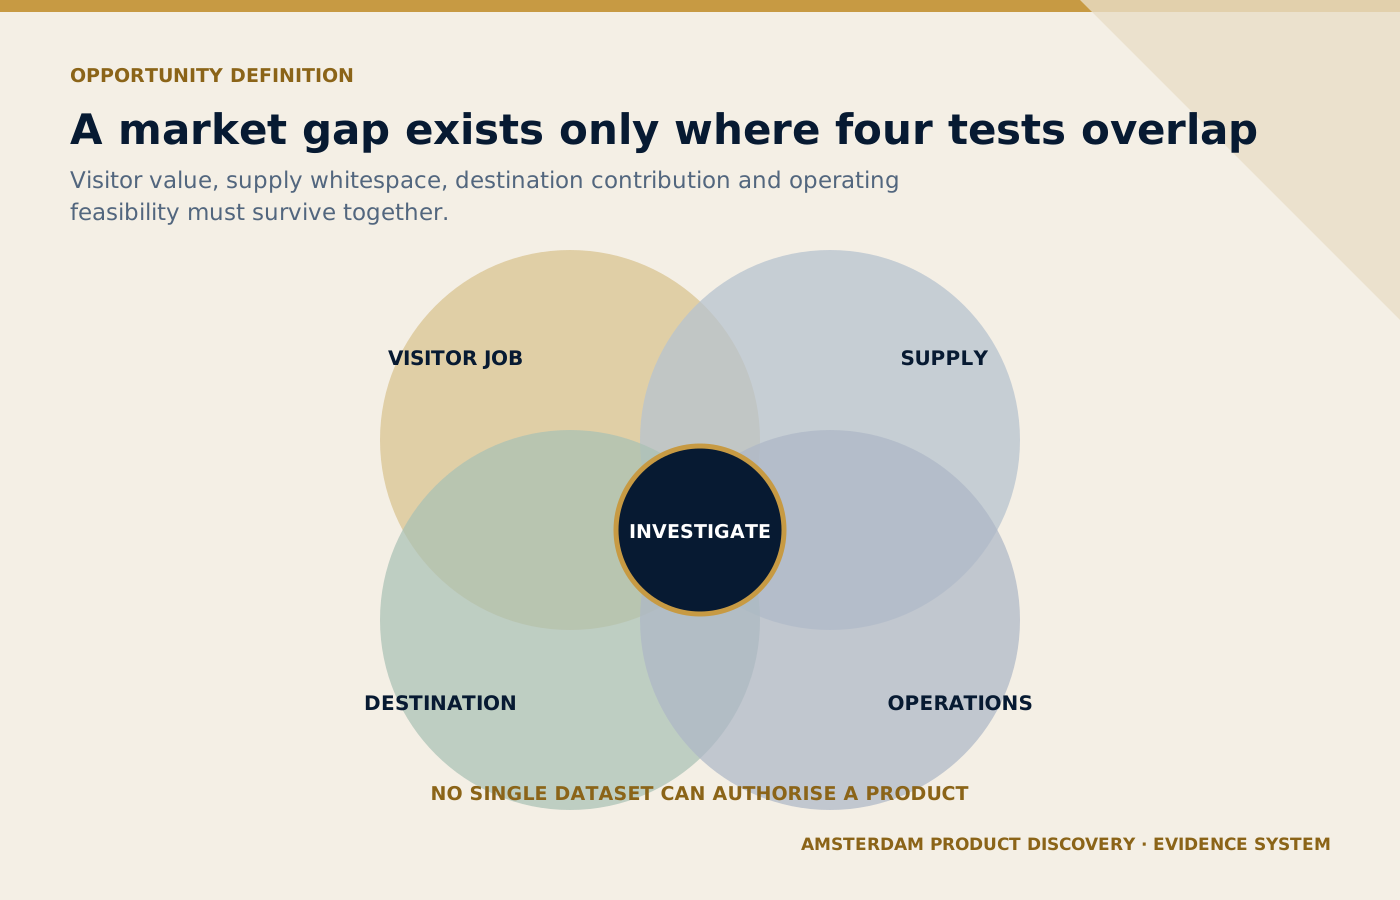
No single source can establish a market gap; visitor value, public supply, destination fit and feasibility must overlap.
On small screens, scroll the diagram horizontally to read its labels.
#What counts as evidence in this article
Four evidence classes remain separate. Observed facts are directly recorded in the frozen dataset or an authoritative external source. Derived metrics are calculations from those observations, such as reconciled family counts or median review-count proxies. Hypotheses are testable propositions such as H01–H06. Assumptions are conditions the project currently accepts provisionally but must validate. No derived score is promoted into an observed fact.
The frozen supply has 62 direct and 16 substitute product families. Category counts are 14 canal, 13 walking, nine self-guided, eight cycling, eight hybrid, seven food, six pass/attraction, six regional/day-trip, four bundle and three performance/other families. This is a purposive research sample, not Amsterdam market share.
#Demand context: Amsterdam does not need more visitors to prove tourism demand
Amsterdam Research and Statistics reports 23.7 million tourist overnight stays in 2025 and forecasts 25.0–29.4 million by 2028. The same official research records roughly 14 million unique tourist day visitors and 10 million stay visitors in 2024. The strategic problem is therefore not whether Amsterdam attracts visitors. It is whether a proposed experience improves the quality, distribution and value of the visit. Amsterdam O&S visitor forecast and tourism statistics provide the destination-scale context.
Customer-demand signals are more useful when they describe behaviour. O&S surveyed day visitors across seasons and found that walking, museums and shopping dominate stated main purposes; foreign day visitors commonly walk along the canals, visit museums and take canal cruises. That supports the relevance of city discovery, cultural interpretation and multi-activity behaviour, but it does not prove demand for any particular guided format. The day-visitor study is therefore treated as behavioural context, not a concept test.
#Supply: density is evidence of competition, not evidence of failure
The frozen sample is densest in canal and walking families. Canal also has the strongest review-count signal in the sample: 13 of 15 FULL canal listings expose review counts, with a median around 2,736. Walking has broader observed supply but a much lower median review-count proxy among the listings with disclosed reviews. Pass/attraction records show very large review counts in only two observed listings. These differences are useful directional signals, but review count is not booking volume and platform disclosure is uneven.
Supply density cuts both ways. A dense category can mean proven visitor familiarity and strong distribution, while also making undifferentiated entry difficult. A sparse category can indicate whitespace—or simply weak demand. This is why the model never rewards low supply by itself.
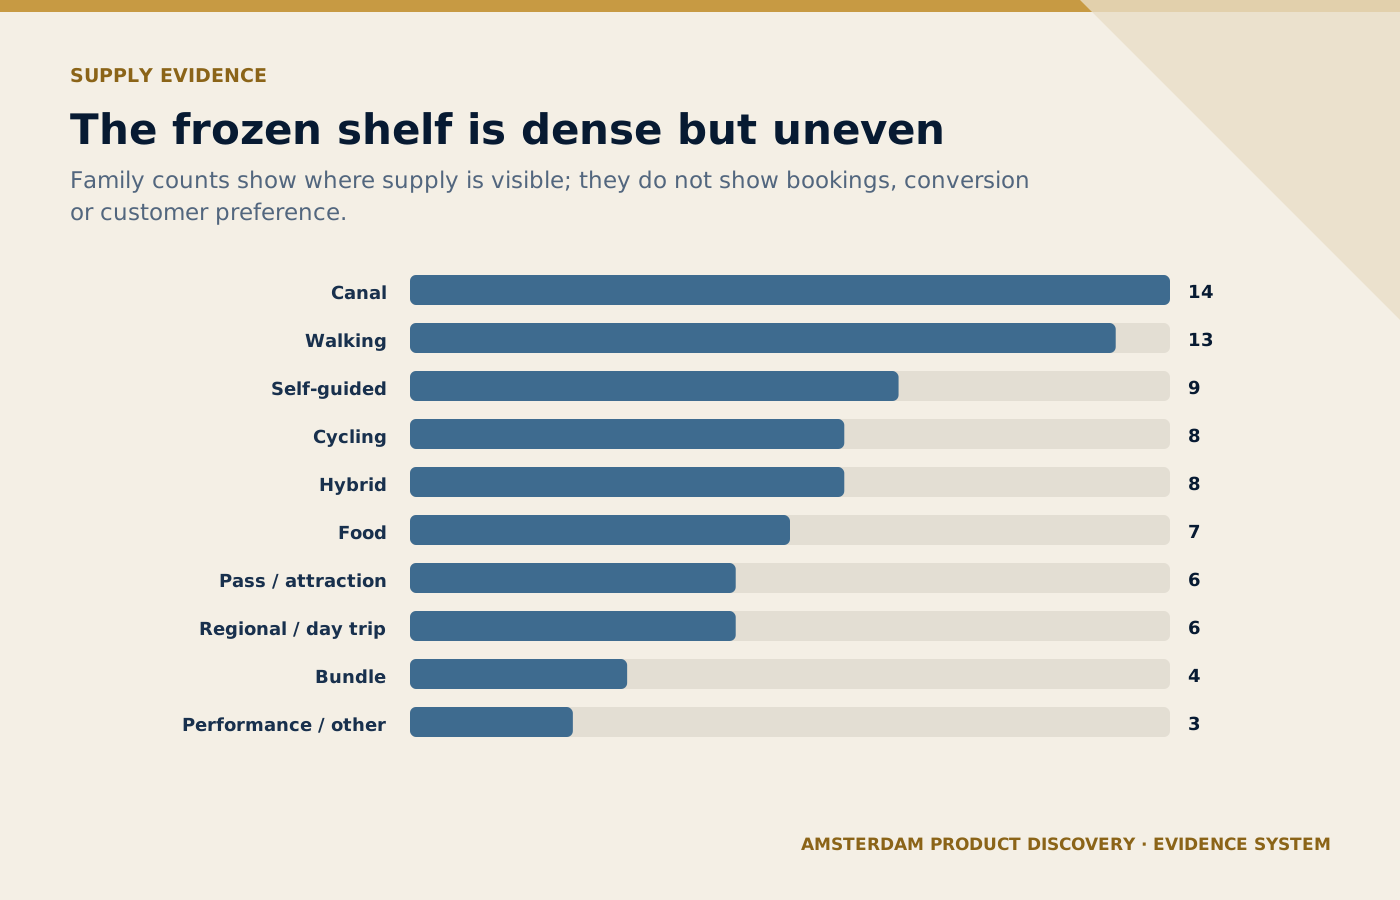
Visible family counts establish supply density but cannot establish bookings, conversion or preference.
On small screens, scroll the diagram horizontally to read its labels.
#Direct competitors, substitutes and the visitor job
Direct competitors in the frozen pack perform similar discovery jobs: seeing the city from water, walking with interpretation, cycling efficiently, eating through neighbourhoods or exploring independently. Substitutes compete for the same time and budget through attractions, performances, passes and bundles. A visitor with three free hours does not compare only “walking tour versus walking tour”; they may compare a canal cruise, museum, immersive attraction, self-guided audio route or neighbourhood food experience.
That visitor-job lens matters commercially. It prevents a false gap created by narrow category labels. It also raises the standard for differentiation: “hidden gems,” “local,” “small group” and “authentic” are positioning claims already visible across public supply. A new concept must demonstrate a meaningful combination of job, audience, place, delivery and operating model—not merely a new adjective.
#Destination fit changes the definition of opportunity
The City of Amsterdam explicitly wants creative and sustainable entrepreneurship that is attractive to visitors while contributing positively to the city and residents. It also wants visitor growth controlled, nuisance reduced and visitors spread more evenly. The municipal tourism policy therefore makes destination value a hard screen rather than a branding bonus.
This is reinforced by 2025 carrying-capacity research: six neighbourhoods were assessed as under pressure, including areas in the historic centre and De Pijp. Other neighbourhoods have high pressure with only moderate liveability. A concept that depends on adding groups to already stressed streets may score well on familiar visitor demand but poorly on destination fit. Conversely, “outside the centre” is not automatically responsible: dispersal only creates value when the route, mobility, resident impact and visitor proposition are genuinely workable. O&S carrying-capacity research supplies the policy evidence.
#Sample and methodology: what entered the screen
The supply side is locked to the Phase 2E freeze rather than refreshed opportunistically while writing this article. The analytical unit is the reconciled product family, not the marketplace listing. That prevents the same underlying experience appearing on two platforms from receiving double weight. Listing-level fields are still used where disclosure matters—for example review count, language or source coverage—but family counts describe competitive breadth. The 24 original pilot observations remain audit evidence and do not silently inflate the 84-FULL analytical sample.
External demand evidence is deliberately narrow and authoritative. Destination volume, visitor behaviour, carrying capacity and policy come from Amsterdam Research and Statistics or the City of Amsterdam. OTA rankings, search-result positions and promotional badges are not imported as demand variables. This prevents a common circular error: using a marketplace's merchandising system to prove demand for products discovered through that same marketplace.
The analysis proceeds in five steps. First, describe reconciled supply by category and competitor class. Second, add behavioural demand context and cautious popularity proxies. Third, screen destination fit and visible operating complexity. Fourth, score category-level problem spaces using the declared six-dimension model. Fifth, change the weights and observe whether the shortlist is stable. The output is a research priority, not a market-size forecast.
#Analytics used—and why these visuals were chosen
Descriptive counts answer the supply question because the sample is purposive: percentages are useful for internal composition but are not presented as Amsterdam market share. Median review count is preferred to the mean when a popularity proxy is shown because a few listings have extremely large review totals and would otherwise dominate the summary. Even the median remains a proxy subject to platform age, review solicitation and disclosure differences.
The opportunity matrix is the primary visualization because the decision is multi-criteria. A one-dimensional ranking would hide the tension between familiar demand and destination pressure, or between whitespace and operating complexity. The matrix makes those trade-offs visible. The sensitivity chart is paired with it because weighted scoring can create false precision; showing rank movement is a direct way to reveal how much the conclusion depends on management priorities.
A conventional price box plot is intentionally omitted. Only 12 date-independent digital observations passed the Phase 2E comparability gate, so a cross-category price chart would visually imply comparability that does not exist. Likewise, no heat map of “demand” is created from review counts. The visualization rule is simple: if the chart would make the evidence look stronger than the underlying measurement, do not publish the chart.
#Confidence: score the evidence before trusting the score
Confidence is assessed separately at claim level. High confidence is reserved for frozen governed observations or recent official destination statistics and policy. Medium confidence covers derived supply metrics with adequate observations but known disclosure bias. Low to medium confidence applies to the opportunity score because several dimensions are ordinal judgements built before primary customer and commercial research. Low confidence applies where only a small number of listings disclose the relevant proxy.
This separation changes how managers should read the matrix. A category can score 4.0 while remaining low confidence; that means the available evidence makes it worth investigating, not that there is an 80% probability of success. Conversely, a dense category can score lower on whitespace while still having high-confidence evidence of visitor familiarity. Confidence is not a bonus point. It is a warning label on the decision.
#The opportunity-scoring model
The screen uses six dimensions scored from 1 to 5. Demand signal combines official behavioural relevance with cautious public popularity proxies. Supply whitespace rewards room to differentiate but never assumes scarcity equals demand. Differentiation asks whether the observed feature set leaves a credible problem to solve. Destination fit reflects municipal priorities and crowding constraints. Operating feasibility considers complexity visible at this stage: mobility, guide dependency, suppliers, weather exposure and access. Seasonal resilience asks whether the format can remain useful across changing conditions.
The base model weights the six dimensions broadly evenly, with slightly more emphasis on demand and destination fit. Confidence is shown separately. A low-confidence 4.0 is not treated as stronger than a high-confidence 3.7. Commercial margin is intentionally not scored as if known: H05 remains untested because commission, costs, capacity economics and willingness to pay are absent.
| Category | Families | Base score /5 | Confidence | Interpretation |
|---|---|---|---|---|
| Self-guided | 9 | 4.50 | Medium | Operationally resilient and differentiable; customer value still needs testing. |
| Walking | 13 | 4.00 | Medium | Strong behavioural relevance and feasibility, but substantial existing supply. |
| Pass/Attraction | 6 | 3.50 | Low | Strong popularity proxies but weak whitespace and often supplier-dependent. |
| Performance/Other | 3 | 3.50 | Low | Strong substitute pull; not evidence that the project should become an attraction. |
| Food | 7 | 3.50 | Medium | Visitor relevance plus context potential, with supplier and cost complexity. |
| Canal | 14 | 2.67 | Medium | Powerful observed popularity but dense supply and limited whitespace. |
Scroll horizontally to read every column. Keyboard: focus the table, then use the arrow keys.
What to learn: Read each row across to connect Category with Families, Base score /5, Confidence, Interpretation. Compare the rows to identify the relevant category for your situation; use the accompanying section to interpret the result.
The full ten-category matrix is published as a downloadable research artifact. The table above intentionally highlights the logic rather than declaring a winner. Self-guided scores strongly because it is operationally flexible, year-round and relatively easy to differentiate digitally; walking scores strongly because official visitor behaviour supports the job and operating requirements are comparatively simple. Neither result proves willingness to pay, satisfaction or a defensible commercial position.
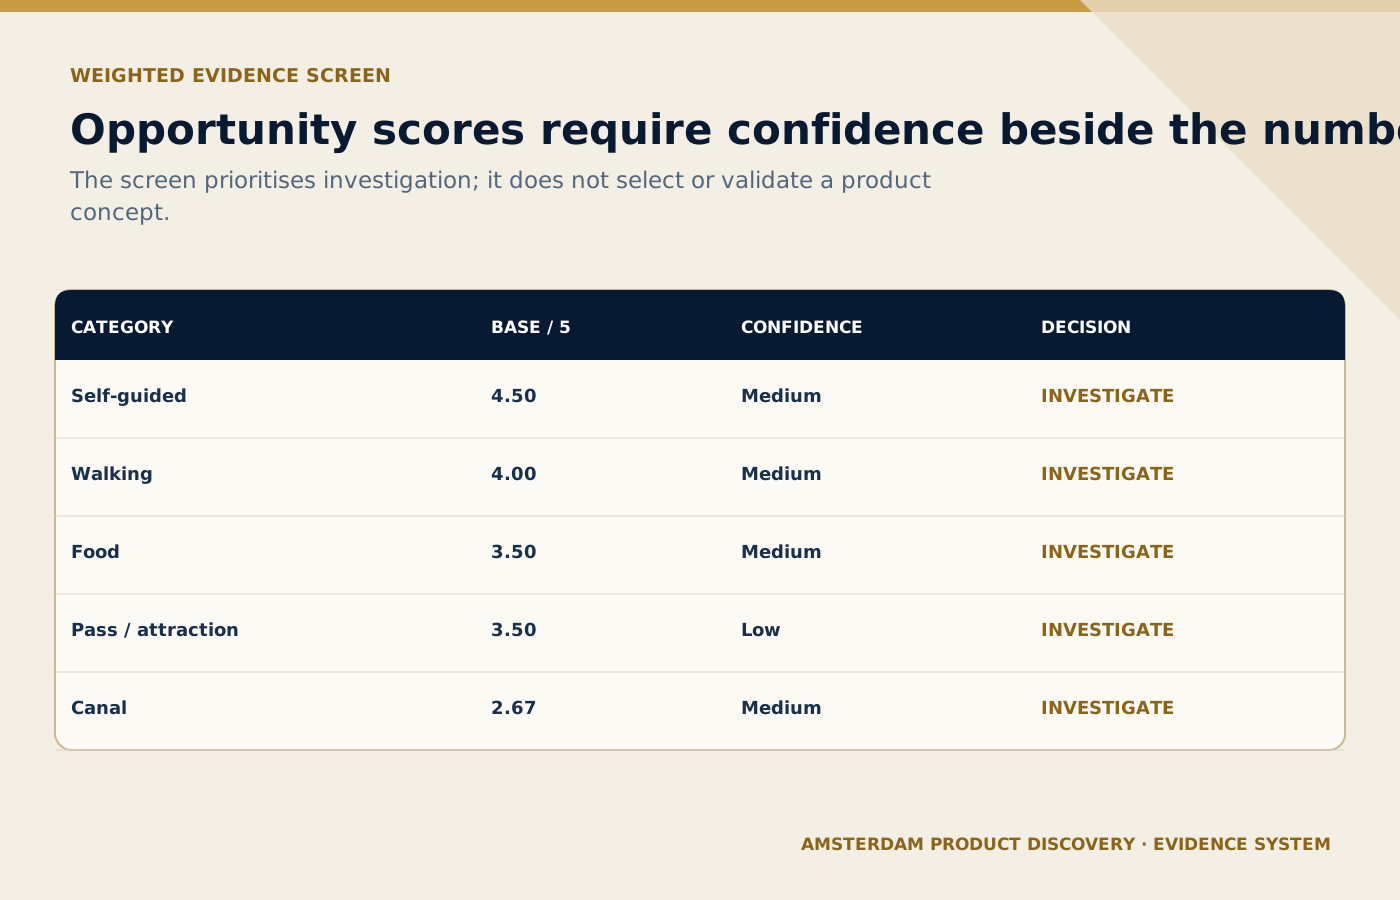
Confidence travels beside every weighted score so a ranking cannot be mistaken for validation.
On small screens, scroll the diagram horizontally to read its labels.
#Price position: the evidence is too narrow for category economics
Phase 2E allowed only 12 date-independent digital observations into normalized price analysis. Seventy-two FULL observations were excluded from pooled price statistics because a common service-window checkout price was not verified or the price basis was not comparable. That is a feature of the governance system, not a weakness to hide.
Accordingly, Article 03 does not calculate a citywide average tour price, category price ladder or margin opportunity. The 12 digital prices can describe the observed self-guided digital shelf only. Any claim that a guided walking, canal, cycling or food concept is “premium,” “cheap” or commercially attractive would outrun the evidence.
#Seasonal resilience and operating feasibility
Amsterdam's demand is large, but product resilience is not simply annual visitor volume. Outdoor walking and cycling face weather exposure; canal products depend on vessels, capacity and operator relationships; food products add supplier availability and dietary complexity; regional products add transport and longer operating windows; attractions and passes depend on inventory and partner terms. Digital/self-guided formats reduce some staffing constraints but introduce content quality, device, navigation and low-touch service risks.
At this stage feasibility scores are therefore directional. Article 06 will need geography and route evidence, Article 08 will need unit economics, and Article 09 will need formal risk and destination-responsibility review. Article 03 only asks whether a problem space is worth carrying forward.
#Sensitivity analysis: does the shortlist survive different priorities?
A single weighted score can hide management bias, so the model is recalculated under four scenarios: balanced, demand-heavy, destination-heavy and operations-heavy. Rankings move when priorities change. That movement is informative. Categories that only look attractive under one weighting are fragile hypotheses; categories that remain near the top across several scenarios deserve deeper research.
The sensitivity file preserves every scenario and rank. The purpose is not to engineer a stable winner. It is to expose where the recommendation depends on subjective weights. In particular, dense categories improve when demand proxies are weighted heavily, while lower-complexity formats improve when operations or destination fit carries more weight.
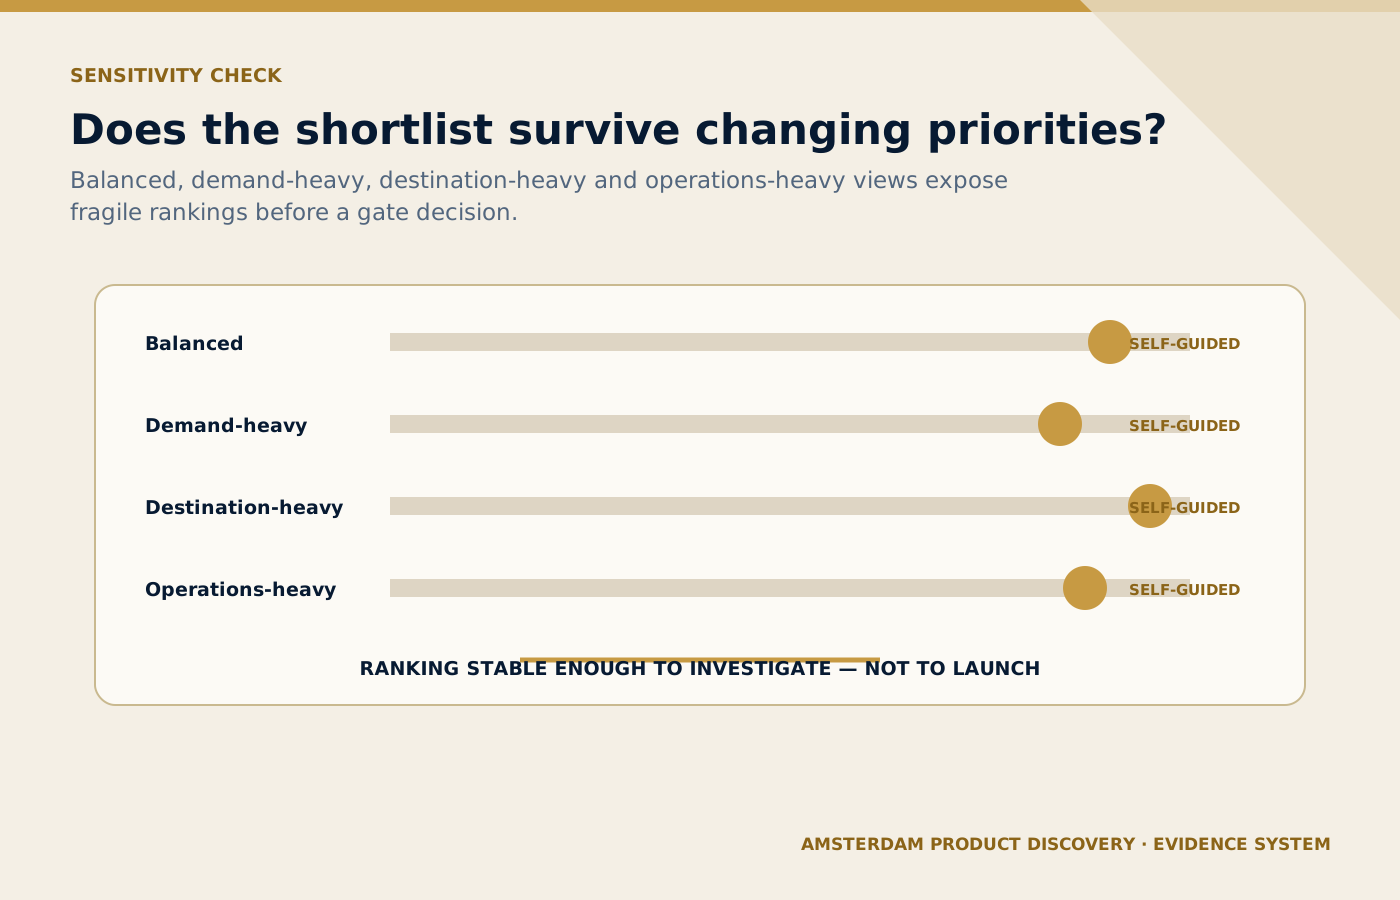
Changing the weighting tests whether the shortlist is robust enough for investigation, not whether it is ready to launch.
On small screens, scroll the diagram horizontally to read its labels.
#What the model still cannot know
Three missing evidence classes prevent a PROCEED-to-concept decision. First, there is no primary voice-of-customer dataset showing frustrations, desired outcomes, willingness to pay or trade-offs. Second, there is no validated unit-economic model covering guide cost, supplier rates, OTA commission, cancellation, capacity and contribution margin. Third, there is no route-level or stakeholder validation demonstrating that a specific geography, group model or operating pattern is acceptable.
Review counts remain popularity proxies, not bookings. Ratings are incompletely disclosed and not normalized across every source. Public languages do not prove guide capacity. Public product descriptions do not prove actual service quality. Destination policy supports responsible dispersal, but does not grant operating permission to a hypothetical route.
#Hypotheses and assumptions after Article 03
H01–H06 remain UNTESTED. Article 03 strengthens context around them but does not convert secondary evidence into validation. H01 gains relevance because walking and cultural discovery are clearly present in visitor behaviour; H03 becomes more important because carrying-capacity pressure and dispersal policy are explicit; H06 gains a clearer policy boundary. H02, H04 and H05 remain particularly dependent on primary customer, capacity and commercial evidence.
A01 changes from an open assumption to SUPPORTED_FOR_PUBLIC_RESEARCH because Article 02 has demonstrated a governed, provenance-controlled public-data workflow. A02–A05 remain open. That is intentional: recruitment, stakeholder access, route feasibility and destination contribution still require future evidence.
#Copy-ready AI prompts for the next analytical pass
ROLE: Tourism market analyst.
TASK: Compare category-level opportunity signals without selecting a product.
INPUTS: Frozen family table, category coverage, review-count proxies, official Amsterdam visitor behaviour and destination policy.
RULES: Separate observed facts, derived metrics, hypotheses and assumptions. Never treat reviews as bookings or low supply as unmet demand.
OUTPUT: Evidence table, contradictions, confidence level, and research questions for primary VOC.
ROLE: Product strategy reviewer.
TASK: Stress-test the Article 03 opportunity matrix.
METHOD: Recalculate under balanced, demand-heavy, destination-heavy and operations-heavy weights.
RULES: Do not change source observations. Flag categories whose rank changes materially. Explain which missing evidence would most reduce uncertainty.
OUTPUT: Sensitivity table and decision implications.ROLE: Destination-responsibility analyst.
TASK: Challenge each shortlisted problem space against Amsterdam policy and carrying-capacity evidence.
CHECK: visitor value, resident impact, crowd concentration, mobility, accessibility, nuisance risk and potential positive local contribution.
OUTPUT: PROVISIONALLY COMPATIBLE / NEEDS LOCAL VALIDATION / HIGH RISK, with evidence and unanswered questions.#Decision Gate 1
The evidence does not justify selecting a winning product, approving a route or committing investment. It does justify moving from broad market mapping into focused customer investigation. Amsterdam has strong visitor demand, observable discovery behaviours and a mature competitive shelf; municipal strategy simultaneously raises the bar for destination contribution. The opportunity is therefore not “more tourism.” It is a better-defined visitor job served in a way that can survive customer, commercial, operational and destination tests.
Decision Gate 1: INVESTIGATE.
Carry a small set of problem spaces—not a preferred product—into Article 04. The next evidence must come from customer language: what visitors are trying to accomplish, what frustrates them, what they value, what they avoid and what trade-offs they make. If primary evidence does not support a meaningful problem, the project must be prepared to STOP.
#Sources and working artifacts
- Frozen Article 02 family analysis table
- Article 03 opportunity matrix
- Sensitivity analysis
- Evidence classification register
- Amsterdam O&S — Visitor Forecast 2026–2028
- Amsterdam O&S — Tourist Day Visits
- Amsterdam O&S — Tourism Carrying Capacity 2025
- City of Amsterdam — Tourism Policy
Connect this guide to your next step
Continue with related methods and the wider series.
- Series guideBuilding a Data-Driven Signature Tour.
Explore the complete series and its reading order.
- Related guideWho Should We Build It For? Source Markets, Segmentation, Language and Customer Jobs
Part 05 of a 12-part Amsterdam tourism product-management case study: source-market segmentation, language supply, connectivity and guide feasibility translated into Primary, Secondary and Test research segments.
- Related guideWhat Visitors Really Want: Mining Amsterdam Reviews and Voice of Customer
Part 04 of a 12-part Amsterdam tourism product-management case study: human-first review coding, AI-assisted VOC classification, independent validation, JTBD, Pareto and traceable product requirements.
Put this article into practice
- Separate a visible supply gap from evidence of customer demand.
- Check the opportunity against destination policy and delivery feasibility.
- Record model weights, source limitations and unresolved assumptions.
- Approve the next research question before proposing a product.
Your next step
Carry the verified findings, assumptions and open questions into the next research stage.
Continue to What Visitors Really Want: Mining Amsterdam Reviews and Voice of Customer