
- Who this helps
- DMCs, tour operators, hotels, event departments and Lean practitioners.
- What you can do
- Calculate workload imbalance, read four chart examples and use three master AI prompts to validate an improvement.
Yamazumi Chart: How to Balance Workloads and Reduce Waste in Tourism Operations
A practical Lean Management guide for DMCs, tour operators, excursion teams, hotels and event departments.
A busy team is not necessarily a balanced team
Imagine a DMC preparing three excursions during a 60-minute morning window.
The Coordinator must validate manifests, brief guides and resolve supplier issues. The Reservations Officer confirms bookings and guest information. The Dispatch Officer checks transport readiness.
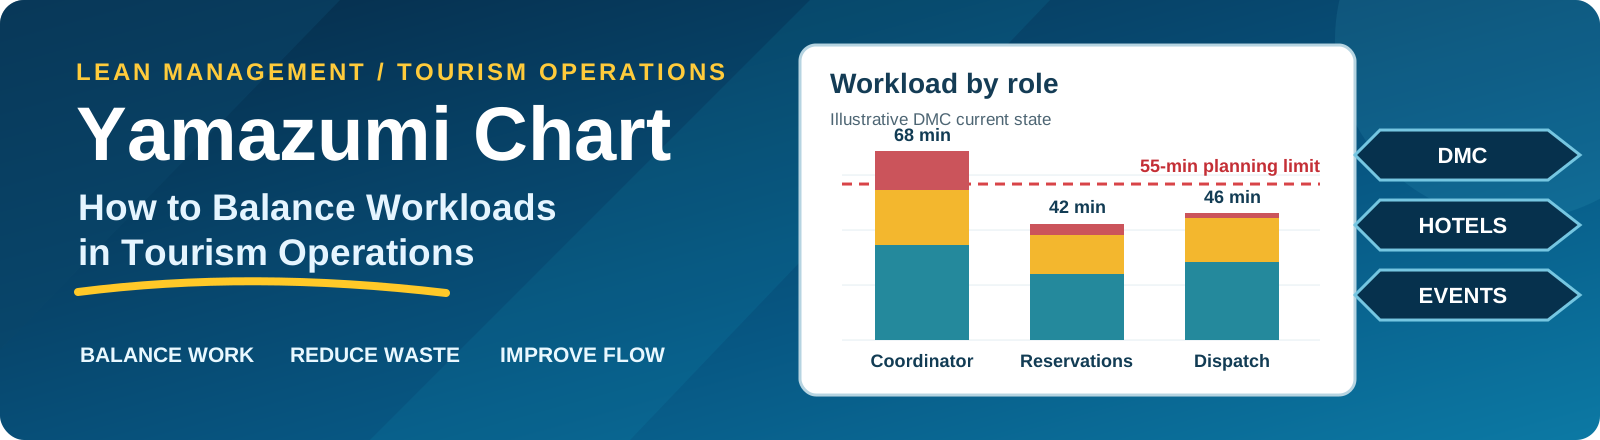
All three employees are busy, but the Coordinator has 68 minutes of assigned tasks. The other employees have 42 and 46 minutes.
The department has 180 minutes of theoretical staff capacity, but that does not mean the work can finish on time. One person is overloaded, and several activities depend on other tasks being completed first.
A Yamazumi chart helps make this problem visible.
In this guide, we explain how to read a Yamazumi chart, investigate Muda, Mura and Muri, calculate the potential benefits of improvement, and use AI to support an evidence-based solution.
The DMC case study uses fictional but operationally realistic numbers. The traditional manufacturing example is supported by published Lean references.
What is a Yamazumi chart?
A Yamazumi chart is a stacked bar chart that displays work elements by employee, role or workstation.
Each bar shows the total assigned task time. The colored sections show the tasks or categories that make up that total.
A horizontal line helps the team compare work content against a meaningful limit.
In traditional production systems, this line is often takt time, calculated from available production time and customer demand.
For the DMC example, the line is a 55-minute workload planning limit within a 60-minute preparation window, with five minutes reserved for minor disruptions. It is not takt time.
Watch the Yamazumi lesson
The video introduces the stacked bars, workload target and excursion-department example.
Why workload balancing matters in tourism
Tourism companies coordinate several activities that must happen in the correct order.
A booking may need to be confirmed before a guest manifest is finalized. A guide may need an approved manifest before briefing passengers. A driver may need the final pickup instructions before departure.
This creates a connected workflow.
When one role receives too much work, the whole process may slow down, even when other employees have spare capacity.
A Yamazumi chart is useful because it encourages managers to investigate the design of work rather than immediately blaming an individual employee.
However, the chart alone does not show the timing and dependencies of every activity. It should be combined with a task sequence or process map.
Understanding Muda, Mura and Muri
Muda: Waste
Muda is work that consumes resources without creating necessary customer value.
In a DMC, potential waste may include repeated entry of guest details, avoidable searching for documents, unnecessary handoffs, and rework caused by incorrect information.
For example, entering the same approved guest details into three separate systems may be unnecessary if a secure and reliable integration can provide the information.
The team must first establish whether each activity serves a necessary operational, safety, legal or financial purpose.
Related channel video: awaiting verified video ID before embedding.
Mura: Unevenness
Mura refers to irregularity or unevenness.
In tourism, this can occur when multiple excursions depart close together, supplier confirmations arrive in batches, or urgent changes accumulate shortly before departure.
A team may appear to have sufficient total capacity while still experiencing periods of severe pressure.
Related channel video: awaiting verified video ID before embedding.
Muri: Overburden
Muri means overburden.
An employee with 68 minutes of assigned work inside a 60-minute window may be experiencing Muri.
The solution is not necessarily to work faster. The manager should investigate duplicate activities, unclear responsibilities, task dependencies and available support.
Related channel video: awaiting verified video ID before embedding.
These three Lean concepts are connected. Uneven demand can create overburden, while overburden can contribute to mistakes and rework.
Case study: Three excursions in 60 minutes
Our fictional DMC has three roles.
| Role | Essential work | Support work | Duplicate work | Total |
|---|---|---|---|---|
| Coordinator | 34 | 20 | 14 | 68 |
| Reservations | 24 | 14 | 4 | 42 |
| Dispatch | 28 | 16 | 2 | 46 |
| Total | 86 | 50 | 20 | 156 |
All values are minutes.
Figure 1: Current-state Yamazumi chart
■ Essential (teal) ■ Support (amber) ■ Duplicate (red) ┆ 55-minute planning limit
The chart reveals three findings.
First, the Coordinator is assigned 68 minutes of work, exceeding the 55-minute planning limit by 13 minutes.
Second, Reservations and Dispatch are below the planning limit.
Third, the department has 20 minutes of work classified as potentially duplicate.
These findings are starting points for investigation, not automatic instructions to remove or transfer tasks.
How overloaded is the Coordinator?
Coordinator utilization against the available hour:
68 ÷ 60 × 100 = 113.3%
Reservations utilization:
42 ÷ 60 × 100 = 70.0%
Dispatch utilization:
46 ÷ 60 × 100 = 76.7%
Total assigned workload:
156 minutes
Total theoretical capacity:
3 × 60 = 180 minutes
Average team utilization:
156 ÷ 180 × 100 = 86.7%
The average hides the problem. The department appears to have spare capacity, yet the Coordinator cannot fit the assigned work into the available hour.
Investigating the duplicate work
The team examines the 20 minutes of potentially duplicate activity.
It discovers that guest information is being copied into multiple files and that some transport details are entered again after being confirmed.
Before changing the workflow, the team checks why these steps exist.
Some information may be repeated because separate departments need approved records. Others may represent unnecessary manual copying.
The improvement should remove avoidable repetition without weakening controls.
Proposed future state
The team proposes removing the 20 minutes of duplicate work.
It also transfers six minutes of necessary support tasks away from the Coordinator.
Four minutes move to Reservations and two minutes move to Dispatch.
During the redesign, the team adds two minutes of necessary validation work to maintain the reliability of the shared information process.
The resulting workload is:
| Role | Essential work | Support work | Duplicate work | Total |
|---|---|---|---|---|
| Coordinator | 34 | 14 | 0 | 48 |
| Reservations | 24 | 18 | 0 | 42 |
| Dispatch | 28 | 20 | 0 | 48 |
| Total | 86 | 52 | 0 | 138 |
Figure 2: Proposed future-state Yamazumi chart
■ Essential (teal) ■ Support (amber) ■ Duplicate (red) ┆ 55-minute planning limit
The Coordinator now has 48 minutes of assigned work.
Reservations has 42 minutes.
Dispatch has 48 minutes.
All three roles are below the 55-minute planning limit.
The work has not simply been shifted from one overloaded employee to another. The proposal removes unnecessary duplication and introduces a small amount of necessary validation work.
Figure 3: Before-and-after workload comparison
Current state Proposed future state
The chart illustrates the proposed changes by role.
Calculating the improvement
Current total task time:
156 minutes
Proposed total task time:
138 minutes
Net reduction:
156 − 138 = 18 minutes
Percentage reduction:
18 ÷ 156 × 100 = 11.5%
Why is the saving 18 minutes rather than 20 minutes?
Because the proposal removes 20 minutes of duplicate work but adds two minutes of necessary validation.
This is an important Lean lesson: a sound improvement does not eliminate every activity that appears unnecessary. It preserves the controls required to deliver a reliable service.
Does the improvement guarantee on-time departures?
No.
The proposed workload is below the planning limit, but task sequence still matters.
For example, the Coordinator cannot approve the final departure manifest before all required booking updates have been received.
A process map should confirm that critical tasks can be completed in the correct order.
The team should also test the process during late supplier changes, booking amendments and other disruptions.
Financial example: What is the released capacity worth?
Assume the DMC operates 20 comparable preparation sessions per month.
The proposed saving is 18 minutes per session.
Monthly released capacity:
18 × 20 = 360 minutes
360 ÷ 60 = 6 staff-hours
Assume a fully loaded illustrative labor cost of €25 per hour.
Equivalent monthly capacity value:
6 × €25 = €150
Equivalent annual capacity value:
€150 × 12 = €1,800
This is not automatically a financial saving.
The value becomes a realized benefit only when the released capacity produces a measurable result, such as reduced paid overtime, avoided additional staffing, or more productive work.
The team should also monitor errors, delays, guest complaints and employee workload.
A second example: Hotel group check-in
Consider a fictional hotel preparing for the arrival of a tour group.
Three employees share the preparation tasks.
| Role | Assigned work |
|---|---|
| Receptionist A | 52 minutes |
| Receptionist B | 31 minutes |
| Guest Relations | 27 minutes |
The preparation window is 45 minutes.
Receptionist A exceeds the available time by seven minutes.
The hotel reviews room-list validation, welcome materials, group documentation and guest communication.
The team discovers that some welcome materials can be prepared earlier and that certain repeated checks may be replaced with a controlled shared record.
The lesson is not to eliminate guest checks. It is to organize the work so that essential checks happen reliably without unnecessary repetition.
A Yamazumi chart can help visualize the workload, but the team must still validate the proposed changes in actual operations.
A documented manufacturing example
The Lean Enterprise Institute describes operator balance charts as tools for distributing work elements in relation to takt time.
Its published discussion of an AIO assembly cell illustrates how work elements can be stacked and compared with takt time to reveal imbalance.
This is the traditional manufacturing application from which the tourism adaptation draws its principles.
Example assembly operators with stacked work elements compared with a 60-second illustrative takt time. These are invented teaching values, not measurements from the published AIO assembly cell.
Dashed red reference: illustrative takt time = 60 seconds. Teal: assembly work; amber: handling and checks.
Teal: assembly work; amber: handling and checks; dashed line: takt = 60 seconds. Operator 1 exceeds takt by 15 seconds, suggesting a line-balance investigation.
Read the documented Lean Enterprise Institute manufacturing discussion for a real-world reference.
The manufacturing example and the fictional DMC example should be clearly distinguished. The DMC figures are educational calculations, not results from the AIO facility.
Use AI to solve the problem, not just draw the chart
AI can help organize task records, check arithmetic, investigate possible causes and prepare a controlled improvement proposal.
However, it cannot independently know how long employees take to perform tasks without reliable input data.
It also cannot determine whether an employee is qualified to perform a transferred task unless that information is provided.
These are full, reusable prompts—not short suggestions. Copy one entire prompt, paste it into your AI assistant, and supply anonymized operational data. Each prompt has a different job: diagnose → audit → implement.
Master Prompt 1 — Diagnose and redesign a Yamazumi workload
Use this first. It requests evidence, validates the numbers and develops a feasible future state.
ROLE: Act as a senior Lean Management and operational excellence consultant with practical experience in tourism, hospitality, events, service operations and manufacturing.

MISSION: Help me investigate a real operational process using a Yamazumi (operator balance) chart, Muda, Mura, Muri, process mapping, root-cause analysis and controlled experimentation. Never pretend to have observed a process or measured tasks that I have not supplied.

STEP 1 — DISCOVERY: Ask for the organization and industry; process name and boundaries; customer demand; preparation or service window; roles and staffing; individual task descriptions and observed durations; measurement method and sample size; task order and dependencies; peak-demand patterns; approvals, safety and legal controls; staff qualifications; systems and handoffs. Ask only the most important missing questions first, in groups of at most five. If I cannot provide a value, mark it UNKNOWN rather than inventing it. Recommend a simple observation sheet.

STEP 2 — DATA VALIDATION: Normalize units and check for missing, overlapping or duplicated tasks, rework, waiting time, parallel activities and unusual observations. Separate observed, estimated and illustrative values. Show arithmetic for each role and for the whole process. Explain why assigned minutes are not automatically equal to elapsed process time. Distinguish actual takt time (available production time divided by demand) from a planning deadline or workload target.

STEP 3 — CURRENT STATE: Build a task-level table with role, task, duration, category, source, predecessor, owner and control requirement. Group tasks into essential work, necessary support and potentially unnecessary duplication, but do not label a control as waste without evidence. Produce chart-ready stacked-bar data and an accessible text interpretation. Calculate workload against the actual time window and identify potential bottlenecks, Muda, Mura and Muri.

STEP 4 — CAUSES: Investigate the imbalance with a process map, 5 Whys or cause-and-effect analysis. Separate confirmed evidence from hypotheses. Consider variability, shift timing, late supplier responses, unclear ownership, fragmented systems, handoffs, competence, quality requirements and demand surges.

STEP 5 — FUTURE STATE: Propose two or three feasible options: eliminate verified waste, simplify or automate approved steps, prepare work earlier and rebalance eligible tasks. For every task transfer, check training, permission, sequence, workload, information access and risk. Do not recommend bypassing guest privacy, safety, payment, legal or quality checks. Show the revised role totals and chart-ready dataset.

STEP 6 — BENEFITS: Calculate before-and-after assigned minutes, net reduction and percentage change, with formulas. Include the cost of any added validation or controls. Separate released capacity from paid overtime savings, cost avoidance and new revenue. Never label an illustrative hourly cost as realized profit.

STEP 7 — PILOT: Define a time-bounded trial, accountable owner, required approvals, baseline, KPIs, measurement frequency, success thresholds, stop conditions, backup staffing and rollback. Include departure readiness, error rate, rework, guest impact and employee strain.

STEP 8 — QUALITY CHECK: Independently recompute all totals, inspect dependencies, identify hidden work and confirm no new role exceeds the relevant time window. Clearly label every assumption and uncertainty.

OUTPUT: Executive summary; discovery questions or input-quality assessment; current-state task table; Yamazumi chart-ready dataset; Lean findings; root-cause evidence; future-state alternatives; before-and-after arithmetic; financial interpretation; risk register; pilot scorecard; management decision checklist. Use plain professional English, useful tables and practical next actions.

START by asking me for my process and available task data. Do not fabricate a case study unless I explicitly ask for a fictional example.
Master Prompt 2 — Independently audit an AI-generated Lean proposal
Paste the first analysis beneath this prompt to challenge its assumptions and arithmetic.
ROLE: You are an independent Lean improvement auditor. Your job is to find errors and unproven assumptions, not to approve the proposal.

INPUT: I will paste a Yamazumi analysis, chart data and proposed future-state process. Treat these as claims requiring verification.

AUDIT METHOD:
1. Recalculate each task sum, role total, team total, workload ratio, capacity change, percentage improvement and any cost calculation. Show discrepancies explicitly.
2. Check whether the chart's reference line is correctly defined: actual takt time versus a deadline-based planning limit. Verify the time units and whether the time window is truly available.
3. Check task precedence, simultaneous work, shared resources, information handoffs and critical-path constraints. A balanced bar chart alone does not prove on-time completion.
4. Challenge the classification of essential, support, duplicate, waiting and rework time. Confirm that proposed waste removal does not remove a necessary legal, safety, privacy, financial or service-quality control.
5. Test every reassigned task against employee competence, permissions, training, system access, labor rules and realistic workload.
6. Search for transferred bottlenecks, uncounted validation, extra monitoring, changeover time, interruptions and peak-demand variation.
7. Separate measured results, modeled results, estimates and unsupported assertions. Flag any claim about real companies that lacks a source.
8. Verify whether monetary claims represent released capacity, avoidable spending, actual payroll savings or revenue gains. Do not confuse these.
9. Evaluate pilot readiness: baseline, comparison period, owner, sample size, stop criteria, rollback, employee consultation and guest-service impact.

CLASSIFY each material finding as VERIFIED, PLAUSIBLE BUT UNVERIFIED, INCORRECT or MORE DATA REQUIRED. Explain the correction, evidence needed and operational consequence.

OUTPUT: Audit verdict; arithmetic reconciliation table; assumptions and evidence register; task-transfer feasibility review; control and compliance risks; chart interpretation corrections; financial-claim review; pilot readiness checklist; prioritized fixes.

FINAL DECISION: Choose exactly one — READY FOR CONTROLLED PILOT, REVISE BEFORE PILOT or INSUFFICIENT EVIDENCE. Explain why. Never approve permanent rollout based only on a visually balanced chart.

Wait for me to provide the proposed analysis if it has not been supplied.
Master Prompt 3 — Build a safe seven-day Yamazumi pilot
Use only after validating the current-state data and future-state design.
ROLE: Act as a Lean implementation manager responsible for a safe, measurable operational pilot.

OBJECTIVE: Convert my validated Yamazumi current state and proposed future state into an executable, reversible pilot for a DMC, tour operator, hotel, events team or another operation.

INPUTS TO REQUEST: Approved process scope; baseline observations and dates; task-level role data; proposed transfers and eliminated tasks; qualifications and training; owner and sponsor; operational time window; guest and supplier dependencies; service-level requirements; safety/privacy/financial controls; available pilot period.

DESIGN THE PILOT:
DAY 1 — Confirm the problem statement, stakeholders, process boundaries, baseline KPIs and decision authority.
DAY 2 — Observe representative tasks and demand variation; validate task durations and document dependencies.
DAY 3 — Confirm current-state Yamazumi chart, planning line and workload totals with employees.
DAY 4 — Test the proposed waste classification and identify root causes, control requirements and likely new bottlenecks.
DAY 5 — Train staff, update temporary checklists, approve task transfers, prepare contingency resources and establish stop conditions.
DAY 6 — Run a supervised trial with live observation, quality checks, backup coverage and incident recording.
DAY 7 — Reconcile results with baseline, capture employee and guest feedback, document limitations and decide whether to extend, revise or stop.

If seven days is insufficient for representative data, recommend a longer pilot and explain why.

DELIVERABLES:
A. RACI matrix with accountable sponsor, pilot lead, each task owner, control approver and data recorder.
B. Detailed daily action plan with inputs, actions, outputs, owner and completion criteria.
C. Before-and-after role workload table and chart-ready data; validate totals.
D. KPI scorecard for workload minutes, role utilization, on-time readiness, manifest accuracy, rework, overtime, guest complaints, employee strain and exceptions. Define formula, source, cadence, owner and baseline for each.
E. Risk register with likelihood, impact, prevention, trigger, response and accountable person.
F. Training and change-communication plan, including access rights and SOP version control.
G. Pilot success criteria; distinguish evidence-based thresholds from proposed provisional targets.
H. Stop conditions and rollback steps that protect customers, employees and required controls.
I. Financial interpretation separating theoretical released hours from realized savings and incremental pilot costs.
J. Management review template with decision options: continue testing, revise, scale with approval or stop.

RULES: Do not invent baseline data. Never assume employee tasks are interchangeable. Do not remove legal, safety, privacy, finance or quality checks without formal review. Do not authorize permanent SOP changes until the pilot has been evaluated and approved.

START: Ask for the validated analysis and the few critical inputs missing from it.
How to collect trustworthy Yamazumi data in the field
A useful Yamazumi chart begins with observation rather than assumptions. Select one repeatable operational window, such as the hour before excursions depart, and identify every work element performed during that period. Record each task's start and finish, the role responsible, the information required and whether the task is sequential or can run in parallel. Observe more than one shift or departure whenever demand varies materially.
Use a consistent unit, normally seconds in manufacturing and minutes in service operations. A task that takes two minutes when systems work normally may take much longer during a supplier outage. Record both the typical duration and exceptions instead of quietly replacing inconvenient observations with averages. Document whether a duration was timed, estimated by an employee or inferred from system records.
Do not interpret every idle interval as removable waste. Staff may be waiting for an approved manifest, a mandatory security check or a supplier response. Those constraints may be better addressed by changing the sequence, improving information flow or creating a clear escalation path rather than deleting the task.
Example observation sheet
| Task | Role | Minutes | Predecessor | Evidence | Control |
|---|---|---|---|---|---|
| Validate manifest | Coordinator | 8 | Final booking update | Timed observation | Guest-data accuracy |
| Confirm vehicle | Dispatch | 6 | Supplier availability | Timed observation | Vehicle readiness |
| Copy confirmed guest list | Coordinator | 4 | Manifest approval | Estimate pending check | Check if duplicate |
The entries above are fictional illustrations of the fields to capture. They are not additional measurements from the DMC case study.
How to interpret the four visuals without overclaiming
Current-state DMC chart: The 68-minute Coordinator bar is longer than the 55-minute planning target and the available 60-minute window. That is a scheduling warning, not a judgment about employee performance. A manager should investigate the actual critical path and which tasks can be done earlier.
Future-state DMC chart: The proposed 48/42/48-minute distribution shows how removing confirmed duplication and transferring eligible support work could reduce overload. It remains a hypothesis until employee capability, task order and quality controls are verified.
Before-and-after chart: The 18-minute net reduction reflects removal of 20 duplicate minutes offset by two minutes of additional validation. It is 11.5% of the original 156 assigned minutes, not an 11.5% reduction in actual departure lead time or payroll cost.
Manufacturing visual: Traditional operator-balance charts often compare work elements with takt time. The manufacturing schematic uses seconds and a demand-derived illustrative reference; the tourism charts use minutes and a planning deadline. These different reference lines must never be described as interchangeable.
Protect guest service and employee trust
Yamazumi should improve the process, not become an individual performance ranking. Involve the people who perform the work, review the task definitions together and explain how measurements will be used. Avoid publishing personally identifiable employee or guest data in the chart or in an AI prompt.
Before any task transfer, confirm competence, authorization, system access, escalation responsibility and workload at peak demand. A four-minute reassignment can fail if the receiving employee does not have the right approval or must wait for information from another team. Keep an exception log during the pilot and use it to refine the future state.
Finally, review a balanced scorecard. Reduced assigned minutes are encouraging, but departures must still be ready on time, manifests accurate, guest communications reliable and employees able to work safely. A credible Lean improvement preserves or improves these outcomes while reducing avoidable effort.
Filter every AI recommendation
Before applying an AI-generated improvement, ask five questions.
Evidence: Is the recommendation supported by observations?
Accuracy: Are the numbers and formulas correct?
Feasibility: Can the proposed tasks be completed in the required order and by qualified employees?
Risk: Are safety, guest service, privacy and operational controls protected?
Value: Will the change deliver a measurable benefit without moving the problem elsewhere?
If a recommendation fails an important check, investigate or revise it before testing.
KPIs for a Yamazumi improvement pilot
| KPI | What to measure |
|---|---|
| Assigned workload | Total task minutes by role |
| Role utilization | Assigned time ÷ available time |
| Duplicate work | Confirmed unnecessary task minutes |
| Departure readiness | Departures ready by cutoff ÷ total departures |
| Manifest accuracy | Correct manifests ÷ manifests checked |
| Rework | Time or incidents caused by corrections |
| Overtime | Additional paid working time |
| Guest impact | Delays, complaints and service incidents |
Review the measures together.
A faster process is not necessarily better if it increases mistakes or creates excessive pressure.
Seven-day improvement pilot
Day 1: Select the process and define the problem.
Day 2: Observe the work and collect representative task data.
Day 3: Build the current-state Yamazumi chart.
Day 4: Investigate Muda, Mura and Muri.
Day 5: Design and risk-assess the proposed future state.
Day 6: Conduct a supervised test with suitable backup arrangements.
Day 7: Review the results and decide whether further testing is required.
Some operations will need longer observation and testing periods. Seven days is only an illustrative starting framework.
Common mistakes to avoid
Do not treat estimates as measured data.
Do not use Yamazumi charts to rank employees.
Do not assume that every employee should have an identical workload.
Do not ignore task timing and dependencies.
Do not remove essential safety or quality checks.
Do not claim financial savings when only theoretical capacity has been released.
Do not implement a future state without employee involvement, risk review and testing.
Frequently asked questions
What is a Yamazumi chart?
A stacked bar chart showing task time by employee, role or workstation, helping teams investigate workload balance.
What is the difference between Muda, Mura and Muri?
Muda means waste, Mura means unevenness, and Muri means overburden.
Can tourism companies use Yamazumi charts?
Yes. They can adapt the principles to excursion preparation, reservations, dispatch, hotel operations and event coordination.
Can AI create a Yamazumi chart?
Yes, when reliable task data is supplied. AI can prepare chart-ready information and support analysis, but operational decisions require human verification.
Is the 55-minute planning limit takt time?
No. It is an illustrative workload limit within a 60-minute preparation window. Takt time requires available production time and customer demand.
Does removing 18 minutes of work guarantee financial savings?
No. It releases potential capacity. Realized savings must be demonstrated through actual operational or financial outcomes.
Conclusion
If the team is balanced within one departure but overloaded when several groups arrive together, use Heijunka to level the arrival schedule. For the broader improvement method, read Lean Thinking for Tourism Operations.
A Yamazumi chart can reveal problems that are difficult to see when everyone appears busy.
In our fictional DMC example, one coordinator had more assigned work than could fit into the preparation window, while other employees had additional capacity.
The chart helped identify a potential workload imbalance and duplicate activities.
The proposed future state reduced assigned task time from 156 to 138 minutes, a modeled improvement of 11.5%.
The improvement would still need to be tested against real deadlines, operational controls, service quality and employee workload.
AI can help managers analyze the information and design better solutions, but it must not replace observation, professional judgment or appropriate approvals.
Make the work visible. Investigate the cause. Test the improvement. Measure the result.
That is how Yamazumi charts can support better tourism operations.
---
References
Lean Enterprise Institute — Operator Balance Chart https://www.lean.org/lexicon-terms/operator-balance-chart/
Lean Enterprise Institute — Muda, Mura, Muri https://www.lean.org/lexicon-terms/muda-mura-muri/
Lean Enterprise Institute — Why Does No One Ask About Production Flow Anymore? https://www.lean.org/the-lean-post/articles/why-does-no-one-ask-about-production-flow-anymore/
Toyota Motor Corporation — Toyota Production System https://global.toyota/en/company/plant-tours/production-system/
Editorial note: All tourism and hotel case-study figures are fictional educational examples. The documented manufacturing reference is a separate source and should not be presented as a DMC case study.