

- Who this helps
- Tourism quality managers, operations leaders and improvement practitioners.
- What you can do
- Use DMAIC to translate complaint evidence into measures, verified causes, controlled improvements and ongoing monitoring.
#The operating problem
Six Sigma contributes disciplined problem definition, measurement, cause analysis, improvement, and control. Tourism organizations do not need to imitate a factory; they need to define defects and critical-to-quality requirements in ways that respect service variability and guest context. The method is most credible when analysts reveal assumptions, missing data, changing demand, classification uncertainty, and operational limitations instead of presenting every complaint as a perfectly comparable unit. Statistical language should improve the decision, not intimidate reviewers or conceal weak evidence. Tourism operations are unusually exposed at interfaces. Sales may define the promise, Reservations holds changing information, Operations coordinates capacity and decisions, suppliers provide critical resources, field teams face the guest, and Finance or the client needs evidence afterward. A control that works inside one department can still fail at the handoff, during a change, or outside office hours. The method in this article is therefore designed as part of an end-to-end operating system. The wider architecture is explained in the tourism-company operating system, while the document-type comparison separates policies, SOPs, work instructions, checklists, forms, templates, and records. That distinction matters because a management method should generate the right controls and evidence rather than forcing every requirement into one document. This is a practical interpretation for tourism management, not a claim that any cited framework prescribes the exact template shown here. The organization remains responsible for tailoring terminology, depth, approval, safety, privacy, employment, contractual, financial, accessibility, regulatory, emergency, and records controls to its jurisdiction, services, risks, technology, and competence.
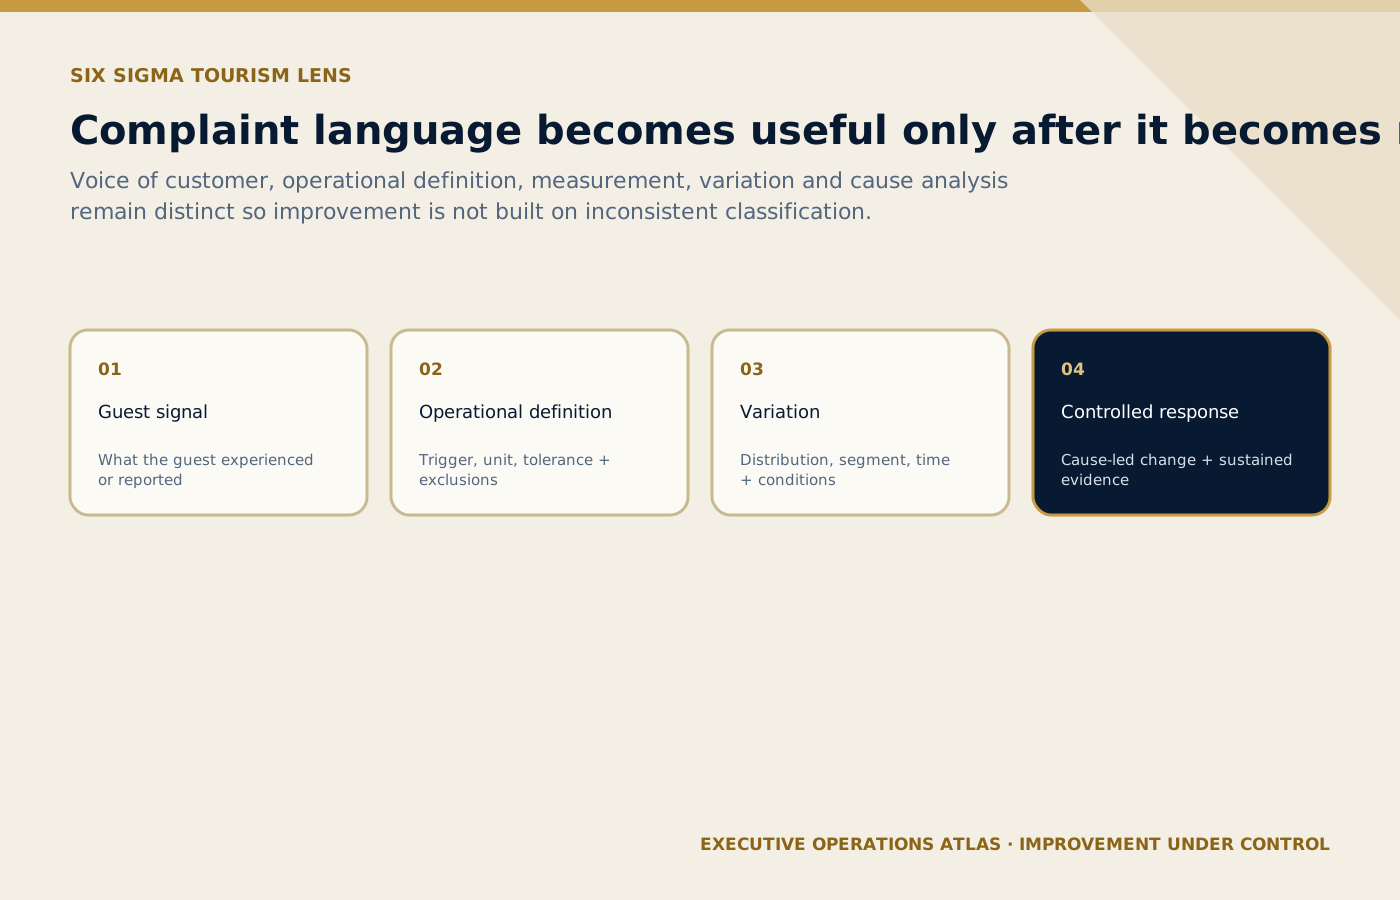
Guest language is translated into repeatable definitions and segmented evidence before the team claims a cause or selects an improvement.
On small screens, scroll the diagram horizontally to read its labels.
#Concepts that must stay distinct
Voice-of-customer language must be translated carefully into critical-to-quality requirements. ‘No one was there’ may involve meeting-point visibility, representative timing, signboard accuracy, guest contact, terminal change, or expectation—not a single punctuality defect. An operational definition tells different competent people how to classify the same event. Define the trigger, start and end times, tolerance, exclusions, source, unit, and decision rule before comparing teams or claiming improvement. Variation matters. Averages hide tails and segments; a nine-minute average wait can coexist with a small but damaging group of forty-minute failures. Examine distribution, time, supplier, service type, location, and changing conditions. Process capability concepts can frame whether a stable process is likely to meet a defined requirement, but they require suitable data and assumptions. In a portfolio article they should guide questions, not create false precision or certification claims.
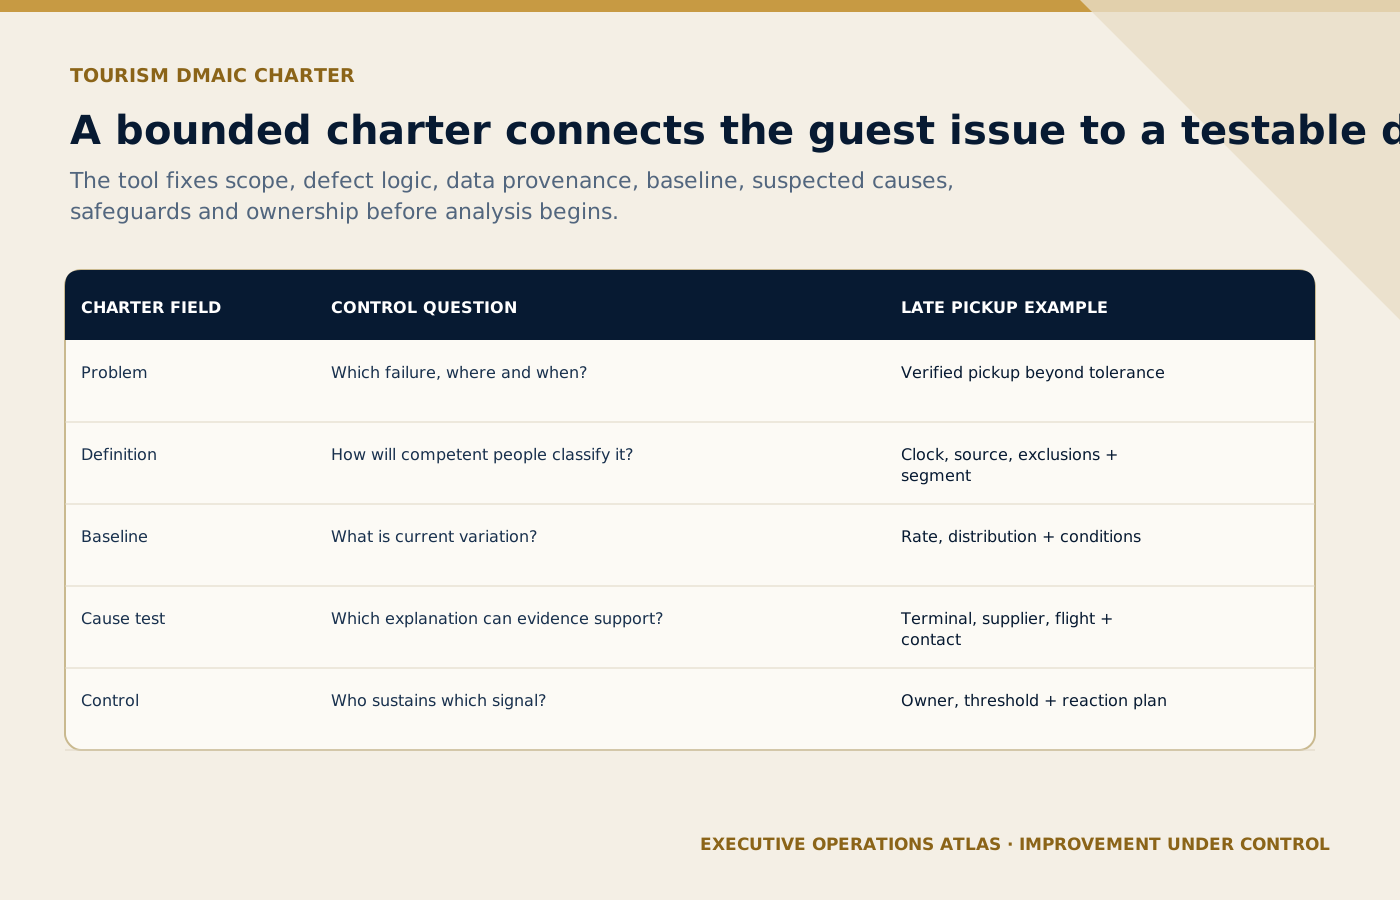
The charter fixes the decision boundary and measurement logic before complaint data is compared or improvement work begins.
On small screens, scroll the diagram horizontally to read its labels.
#Practical tool: Tourism DMAIC charter, defect definition card, and complaint-to-data plan
Use the following canvas in a working session with a current process, representative service records, and the people who perform or receive the work. Mark assumptions and missing evidence openly; a blank or disputed answer is more useful than a confident invention.
| Element | Management question | Tourism application |
|---|---|---|
| Define | What problem and CTQ matter? | Guest can locate the representative within the approved meeting window |
| Measure | How is the defect operationally defined? | Trigger, timestamp sources, tolerance, exclusions, segmentation |
| Analyze | Which inputs explain the pattern? | Terminal, wave, supplier, signboard, contact, flight change |
| Improve | Which verified causes can be changed safely? | Meeting-point design, alert, briefing, capacity, interface |
| Control | How will gains be sustained? | Owner, dashboard, control plan, SOP, audit, response threshold |
| Learn | Where else does the finding apply? | Hotel departures, venues, tours, and partner handoffs |
Scroll horizontally to read every column. Keyboard: focus the table, then use the arrow keys.
What to learn: Read each row across to connect Element with Management question, Tourism application. Compare the rows to identify the relevant element for your situation; use the accompanying section to interpret the result.
The canvas is intentionally compact. Its output should link to the controlled source—process map, risk register, requirement, data definition, SOP, system rule, supplier interface, training record, test, dashboard, audit, or improvement case. Copying detail into several places creates the appearance of completeness while weakening change control.
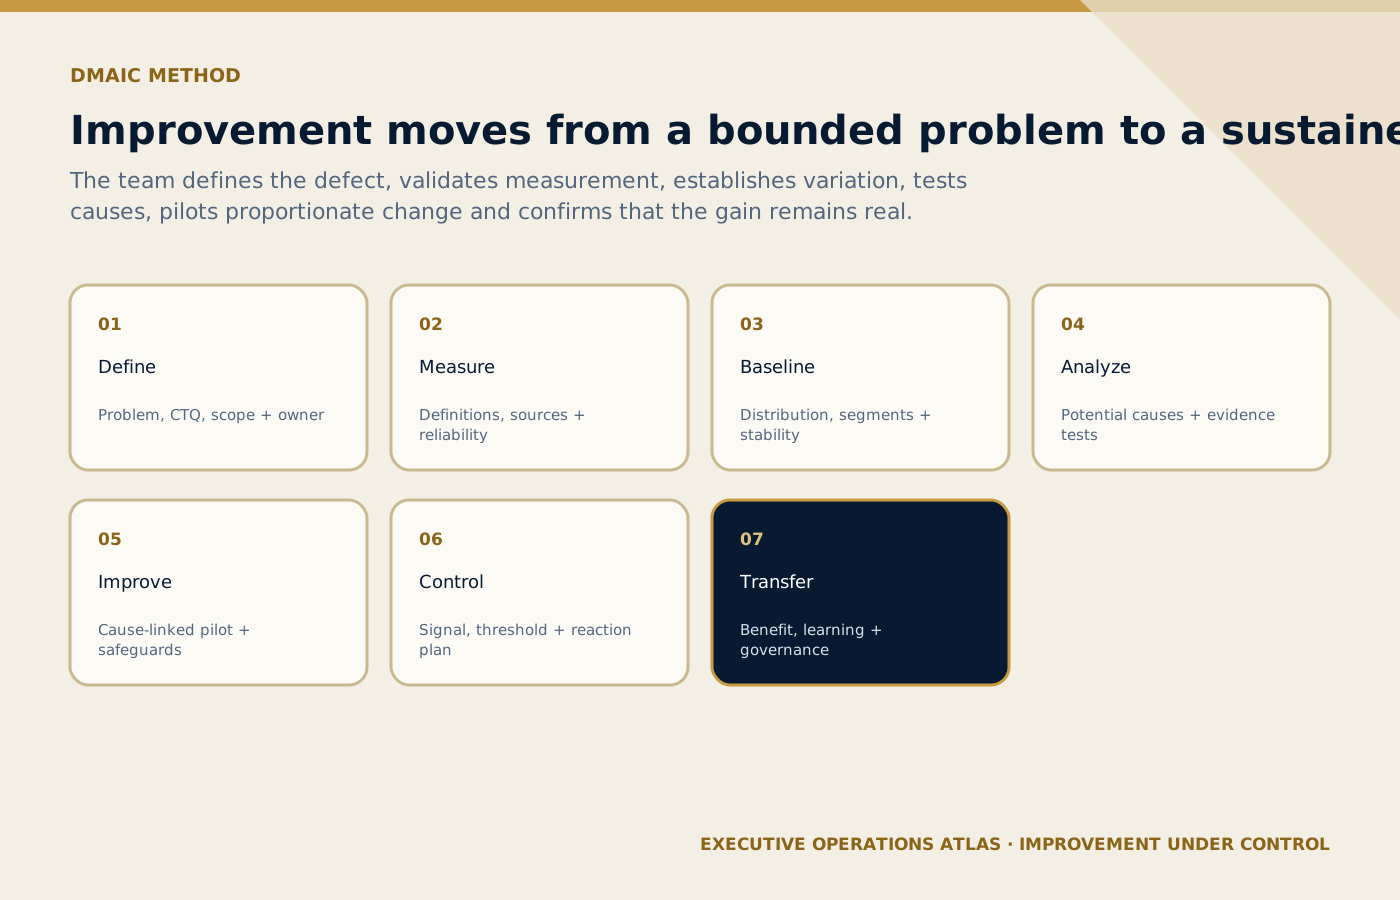
Measurement is validated before analysis, changes are linked to tested causes, and an explicit reaction plan sustains the gain.
On small screens, scroll the diagram horizontally to read its labels.
#A professional method
#Define a bounded problem
Create a charter with business and guest impact, process boundary, defect, CTQ, baseline, goal, scope, team, authority, risk, and timing. Avoid solutions in the problem statement.
#Validate the measurement system
Check timestamp sources, clock alignment, missing values, manual entry, classifications, duplicate complaints, and reviewer agreement. Poor measurement can produce a technically impressive analysis of noise.
#Establish baseline and variation
Show counts, rates, denominators, distribution, time trend, and segments. Compare complaint data with operational records because reporting behavior and service volume affect the apparent rate.
#Analyze potential causes
Use process maps, Pareto, fishbone, Five Whys, stratification, observation, and appropriate statistical methods. Separate correlation from causation and verify leading hypotheses with evidence.
#Design improvements against causes
Generate alternatives, assess risk and guest impact, pilot at controlled scale, and compare with baseline. Include front-line and partner knowledge so the solution fits real operating conditions.
#Create a control plan
Define the process owner, operational definition, data source, sampling or refresh, thresholds, response, audit, document changes, training, and escalation. Control should make deterioration visible early.
#Confirm benefits and transfer learning
Verify sustained results over an appropriate period, report assumptions and limitations, calculate credible operational benefit, and evaluate whether related processes share the verified cause.
At the end of the method, require a decision backed by evidence: proceed, proceed conditionally with named controls, return for correction, or stop. Record the decision maker, date, scope, residual issues, and next review. Ambiguous approval is especially dangerous in tourism because live teams and partners will fill the gap differently under time pressure.
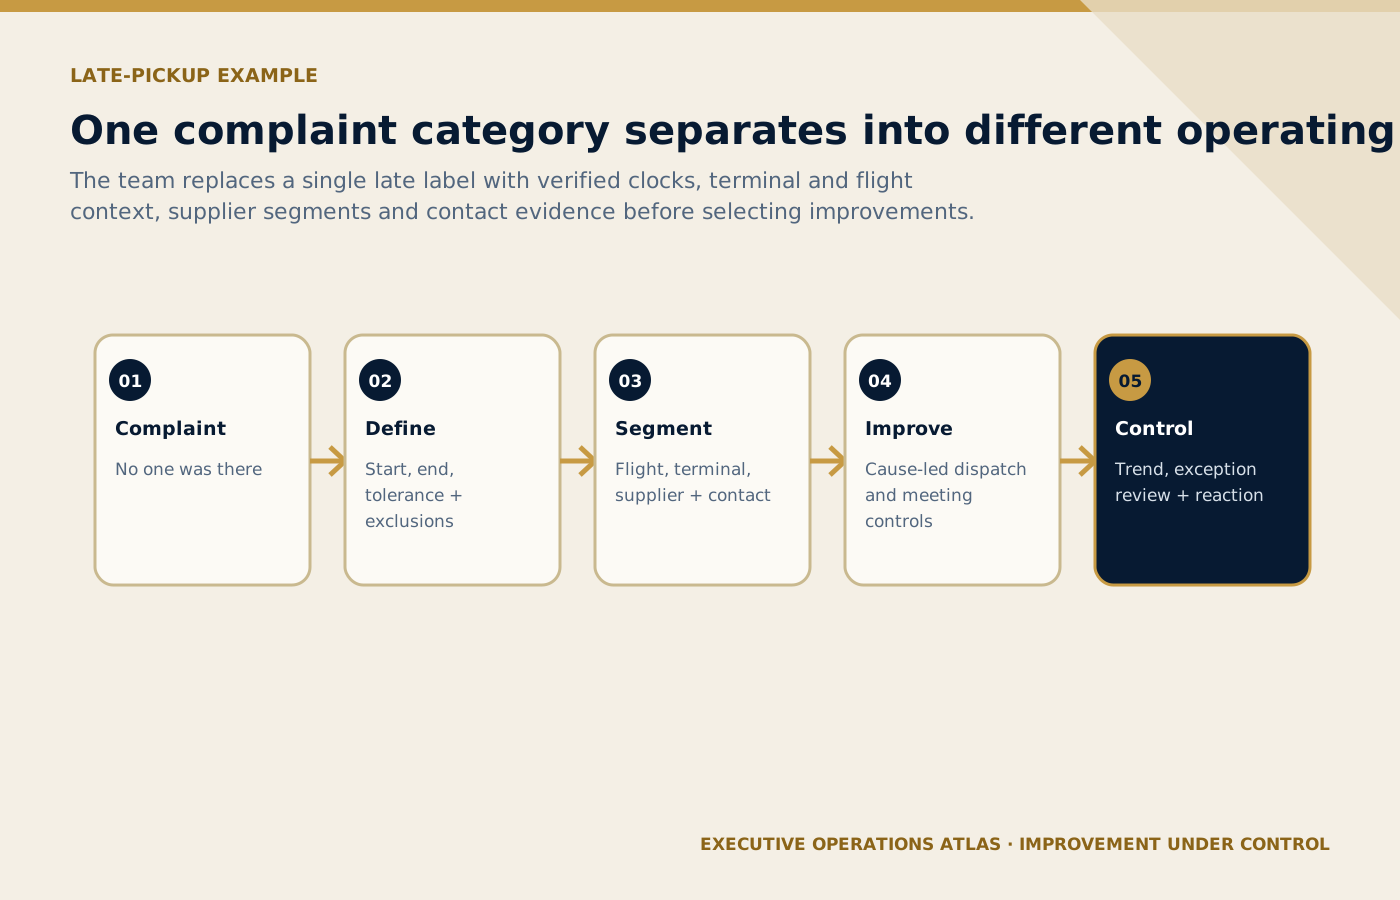
One broad complaint category becomes a set of verifiable operating conditions that can support a proportionate intervention.
On small screens, scroll the diagram horizontally to read its labels.
#Example: Investigating late airport-pickup complaints
Illustrative scenario
Operational teaching scenario, not a documented incident. Uncited figures and outcomes are illustrative assumptions.
- Situation
A tourism team is investigating recurring complaints about late airport pickups.
- Evidence
#Baseline
The total complaint rate appears random, but segmented data shows a strong concentration during clustered arrivals at one terminal and with brief changes sent after coordinators leave staging.
Check the approved service brief, current passenger count, confirmed vehicle and driver, access conditions, deadlines and activation authority.
- Decision
Decide whether to release, wait, reroute or activate the approved backup using verified readiness and the stated decision deadline.
- Action
#Complaint language
Cases coded as ‘late pickup’ include late vehicles, guests at a different exit, incorrect signs, flight-terminal changes, unreachable contacts, and representatives present but not visible.
#Operational definition
The team defines separate defects for resource readiness, meeting-point availability, first successful contact, and departure. Each uses explicit source and time rules.
#Improvement
A controlled alert, standardized sign verification, revised coordinator zones, and a manifest-change cutoff with exception handling are piloted against matched arrival waves.
#Control
The dashboard tracks the four defect types, workload, flight changes, and guest contact outcomes. A response plan activates before complaints rise, and audits confirm that timestamps are not being backfilled.
The example is not a universal SOP. A company should repeat the reasoning with its own service promise, systems, suppliers, volumes, guest profiles, legal environment, and disrupted conditions. Compare the design with operational risk assessment and customer-journey mapping for SOP design so operational control, risk, and the visible guest journey remain connected.
#Common failure modes—and the management response
- Treating all complaint labels as one defect. Trace the operational consequence using a recent case, then identify the earliest control that could have prevented, detected, or safely contained the condition.
- Using counts without service-volume denominators. Follow the issue across upstream inputs and downstream handoffs. The visible lapse may originate in workload, information, authority, system design, supplier behavior, or an incentive outside the user's control.
- Skipping measurement-system checks. Decide whether the remedy belongs in process design, the SOP pack, technology, resource planning, supplier governance, competence, or leadership policy. Adding prose to the wrong document will not control the cause.
- Confusing correlation with verified cause. Test the proposed remedy in a normal case and a credible exception. Confirm that improvement in one measure has not transferred delay, risk, cost, or confusion to another role or the guest.
- Piloting only in easy conditions. Assign one accountable owner, evidence, due date, and review point. An informal workaround may protect today's service but should not silently become the future operating method.
- Celebrating a short-term average while tail failures remain. Record the residual risk and escalate it through the approved route. A vague warning such as ‘take care’ is not an observable control and cannot support an effectiveness decision.
- Verification
Reconcile the physical count with the movement record, confirm the receiving team’s handover and keep unresolved passengers or tasks open.
#Implementation roadmap
Implementation should be proportionate to risk and change. The same five gates can govern a small improvement or a cross-company launch, but the evidence, independence, resources, testing, and approval depth should match the potential consequence.
#Phase 1: Mandate
Confirm sponsor or owner, scope, authority, success criteria, affected stakeholders, risk, resources, and the evidence required before proceeding. Put unresolved assumptions in an issue log rather than disguising them as approved facts.
#Phase 2: Design
Use observed work, representative records, customer and partner needs, data, risk, and front-line knowledge. Align the method with process maps, SOPs, systems, contracts, supporting tools, roles, and existing governance.
#Phase 3: Pilot
Choose representative normal, boundary, and exception cases. Protect live operations, define acceptance and stop criteria in advance, record actual results, correct defects through control, and retest affected interfaces.
#Phase 4: Release
Verify approved content, access, system readiness, partner acknowledgement, competent users, supervisor coverage, communications, rollback or contingency, monitoring, support, and explicit go-live authority.
#Phase 5: Sustain
Review early use, compare results with baseline, audit deployment and effectiveness, route recurrence through RCA and CAPA, preserve lessons, and control revisions so improvement does not create parallel versions.
Control the approved version through document control and version management. Use training, competency, and SOP adoption to verify competence and adoption rather than counting distribution or attendance. Where suppliers perform part of the process, apply the interface and performance disciplines in supplier and partner governance.
#Measures that support decisions
Select a small balanced set. For each measure define purpose, formula or classification rule, numerator and denominator where applicable, source, owner, refresh, segmentation, target, response threshold, and known limitations. A measure without an action route becomes reporting overhead.
| Measure | Decision use |
|---|---|
| Complaints mapped to controlled defect definitions | Shows whether the method is deployed, producing its intended result, exposing risk early, or requiring investigation and controlled improvement |
| Records passing measurement-quality checks | Shows whether the method is deployed, producing its intended result, exposing risk early, or requiring investigation and controlled improvement |
| Defect rate with denominator and segments | Shows whether the method is deployed, producing its intended result, exposing risk early, or requiring investigation and controlled improvement |
| Variation within critical service windows | Shows whether the method is deployed, producing its intended result, exposing risk early, or requiring investigation and controlled improvement |
| Pilot effect versus baseline | Shows whether the method is deployed, producing its intended result, exposing risk early, or requiring investigation and controlled improvement |
| Control-plan triggers acted on within threshold | Shows whether the method is deployed, producing its intended result, exposing risk early, or requiring investigation and controlled improvement |
Scroll horizontally to read every column. Keyboard: focus the table, then use the arrow keys.
What to learn: Read each row across to connect Measure with Decision use. Compare the rows to identify the relevant measure for your situation; use the accompanying section to interpret the result.
Read the measures together. A better average can hide a damaging tail; a lower complaint count can reflect harder reporting; a perfect checklist score can coexist with weak outcomes; and a rise in recorded exceptions may be healthy when previously hidden problems become visible. Segment results and combine performance data with observation, audit, guest evidence, supplier context, and front-line feedback.
#Field review before approval
#Value and outcome
Can the team state which guest, client, employee, partner, or organizational outcome this method protects, and what evidence would show that value was actually created? Review one successful and one failed service so internal completion is not confused with customer value.
#Boundary and ownership
Are trigger, completion, exclusions, process owner, deputies, and connected services explicit? Follow one service reference end to end and note every point where work crosses a department, system, shift, location, or supplier boundary.
#Risk and resilience
Have credible failure, peak demand, absence, conflicting information, technology loss, supplier failure, accessibility need, and recovery been examined proportionately? Confirm that efficiency does not remove the capacity or discretion needed to stabilize a disrupted service.
#Data and evidence
Are definitions, sources, timestamps, versions, calculations, access, corrections, and retention controlled enough to support the stated decision? Reconstruct an event from records and identify any conclusion that depends on memory, a private message, or an unverified field.
#People and authority
Can representative users explain and demonstrate their role, decision limits, handoffs, and escalation under real working conditions? Include night, weekend, remote, temporary, and partner personnel where they form part of the service.
#Guest and partner interface
Does the design control what external parties need to know, provide, acknowledge, decide, and record without exposing them to contradictory instructions? Walk through the visible guest experience and ask a partner to demonstrate the handoff in their own words.
#Usability and technology
Can the method be used on actual devices, channels, locations, languages, and workload conditions without unofficial notes or coaching? Observe searching, scrolling, duplicate entry, screenshots, manual workarounds, and automation failure as evidence about design.
#Learning and governance
Will incidents, complaints, defects, tests, audits, measures, user feedback, supplier signals, and external change reach a named review and controlled decision? Distinguish urgent correction, formal CAPA, routine revision, project change, and strategic improvement.
#How this article connects to the series
The most useful connected articles are root cause analysis, Lean thinking for tourism operations, tourism KPIs and control dashboards. Each supplies a prerequisite, complementary control, or next improvement step; the links form a deliberate route through the series rather than promotional references added after drafting. The existing portfolio demonstrates the operating context in Tour Guide Quality Index, The Fleet Control Tower, Before the Delegate Reaches the Hotel. Those pieces show journeys, assignments, control rooms, dashboards, guide quality, AI tools, commercial workflows, or recovery in practice. This article adds the management method behind repeatable delivery.
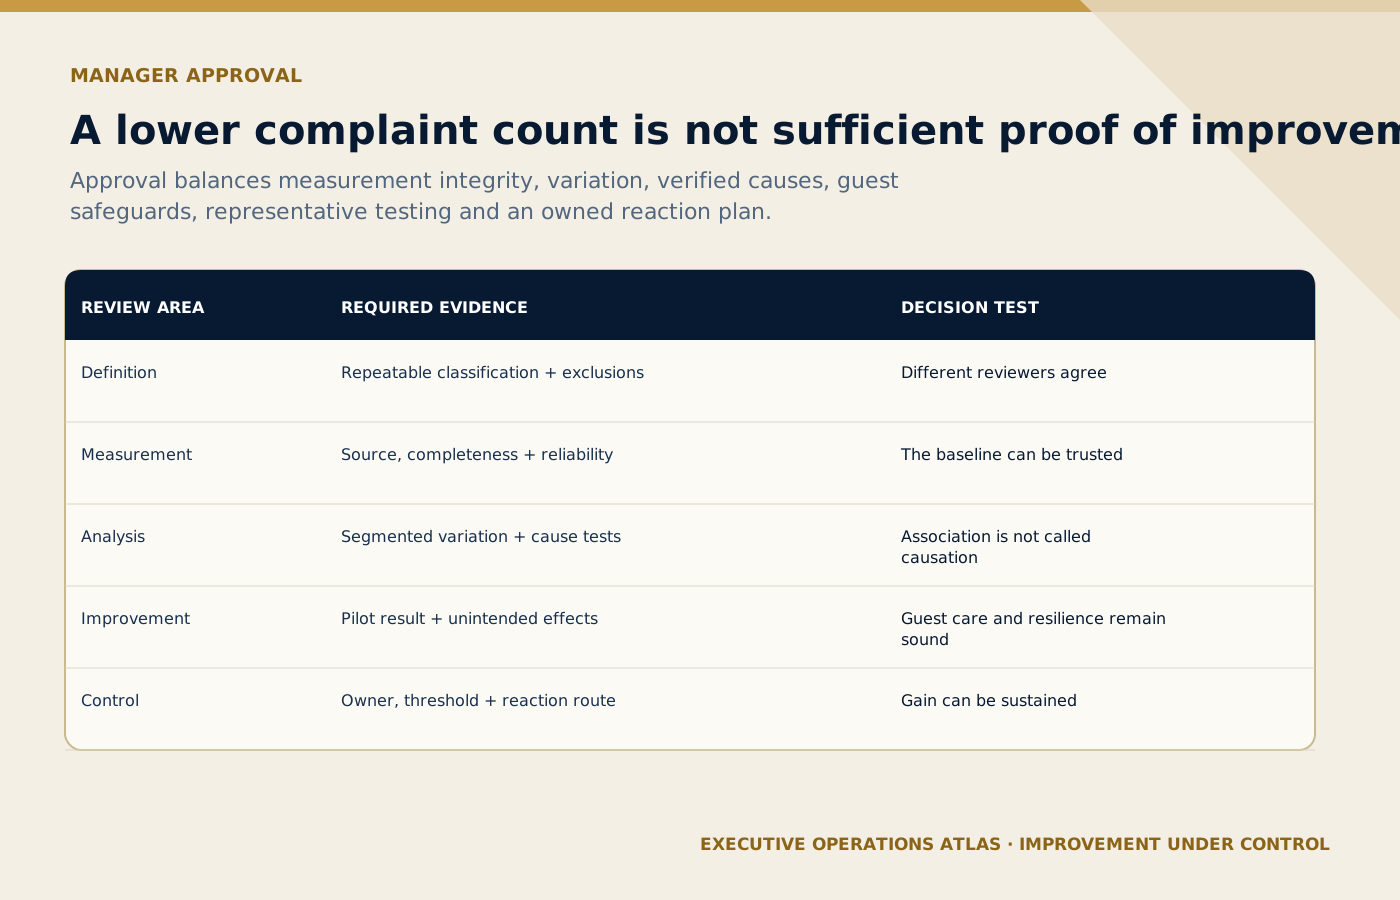
Approval requires reliable evidence and an owned control response rather than a lower complaint total viewed without context.
On small screens, scroll the diagram horizontally to read its labels.
#Manager's approval checklist
- The purpose, service value, scope, owner, users, authority, and required outcome are explicit.
- The method reflects observed work, current systems, representative data, guest needs, partners, risk, and disrupted conditions.
- Definitions, roles, thresholds, evidence, privacy, accessibility, safety, exceptions, and escalation are controlled at the appropriate level.
- Supporting documents, systems, tools, contracts, training, tests, dashboards, and records agree with one another.
- Representative users and partners have demonstrated the design in normal and exception scenarios without hidden coaching.
- Release, access, version, support, monitoring, audit, change, retention, improvement, and withdrawal arrangements are ready.
#Sources and further reading
Primary standards, institutional guidance and professional references used to support this article.
- ISO 13053-1:2011 — Six Sigma and the DMAIC methodology
- ISO 13053-2:2011 — tools and techniques for DMAIC
- ASQ — DMAIC: Define, Measure, Analyze, Improve, Control
- ASQ — seven basic quality tools
Editorial note: This article provides operational and quality-management guidance for a professional portfolio. It does not provide legal, regulatory, privacy, safety, emergency, employment, financial, or contractual advice, nor does it replace official framework training or certification materials. Apply qualified local review wherever those obligations affect the service.
Connect this guide to your next step
Continue with related methods and the wider series.
- Related guideThe Integrated SOP Creation Model: ITIL + PMP + Lean Six Sigma
Combine service value, project delivery, flow, variation, documented information, risk, testing, competence, measurement, audit, and improvement into one practical SOP lifecycle.
- Related guideTourism Operations KPIs and Control Dashboards
Build a decision system that balances service outcomes, process control, guest experience, risk, people, suppliers, finance, and improvement without drowning managers in data.
- Related guideFrom SOP Library to Tourism Operational Excellence Management System
Transform a collection of controlled documents into an integrated system that aligns value, governance, capability, execution, evidence, measurement, learning, and sustained service excellence.
Put this article into practice
- Use DMAIC to translate complaint evidence into measures, verified causes, controlled improvements and ongoing monitoring.
- The purpose, service value, scope, owner, users, authority, and required outcome are explicit.
- The method reflects observed work, current systems, representative data, guest needs, partners, risk, and disrupted conditions.
- Definitions, roles, thresholds, evidence, privacy, accessibility, safety, exceptions, and escalation are controlled at the appropriate level.
Your next step
Use this connected method when you are ready to build a CAPA workflow that separates containment, verified cause, corrective action and effectiveness checks.
Review CAPA: Corrective and Preventive Action in Tourism