

- Who this helps
- Tourism operations managers, analysts and quality leaders.
- What you can do
- Design balanced measures with definitions, sources, owners and review rules that lead to operating decisions.
#The operating problem
A KPI is useful only when its definition, source, owner, frequency, context, and action threshold support a real decision. A dashboard is the operating conversation around those indicators—not a screen filled with attractive numbers. Tourism operations are unusually exposed at interfaces. Sales may define the promise, Reservations holds changing information, Operations coordinates capacity and decisions, suppliers provide critical resources, field teams face the guest, and Finance or the client needs evidence afterward. A control that works inside one department can still fail at the handoff, during a change, or outside office hours. The method in this article is therefore designed as part of an end-to-end operating system. The wider architecture is explained in the tourism-company operating system, while the document-type comparison separates policies, SOPs, work instructions, checklists, forms, templates, and records. That distinction matters because a management method should generate the right controls and evidence rather than forcing every requirement into one document. This is a practical interpretation for tourism management, not a claim that any cited framework prescribes the exact template shown here. The organization remains responsible for tailoring terminology, depth, approval, safety, privacy, employment, contractual, financial, accessibility, regulatory, emergency, and records controls to its jurisdiction, services, risks, technology, and competence.
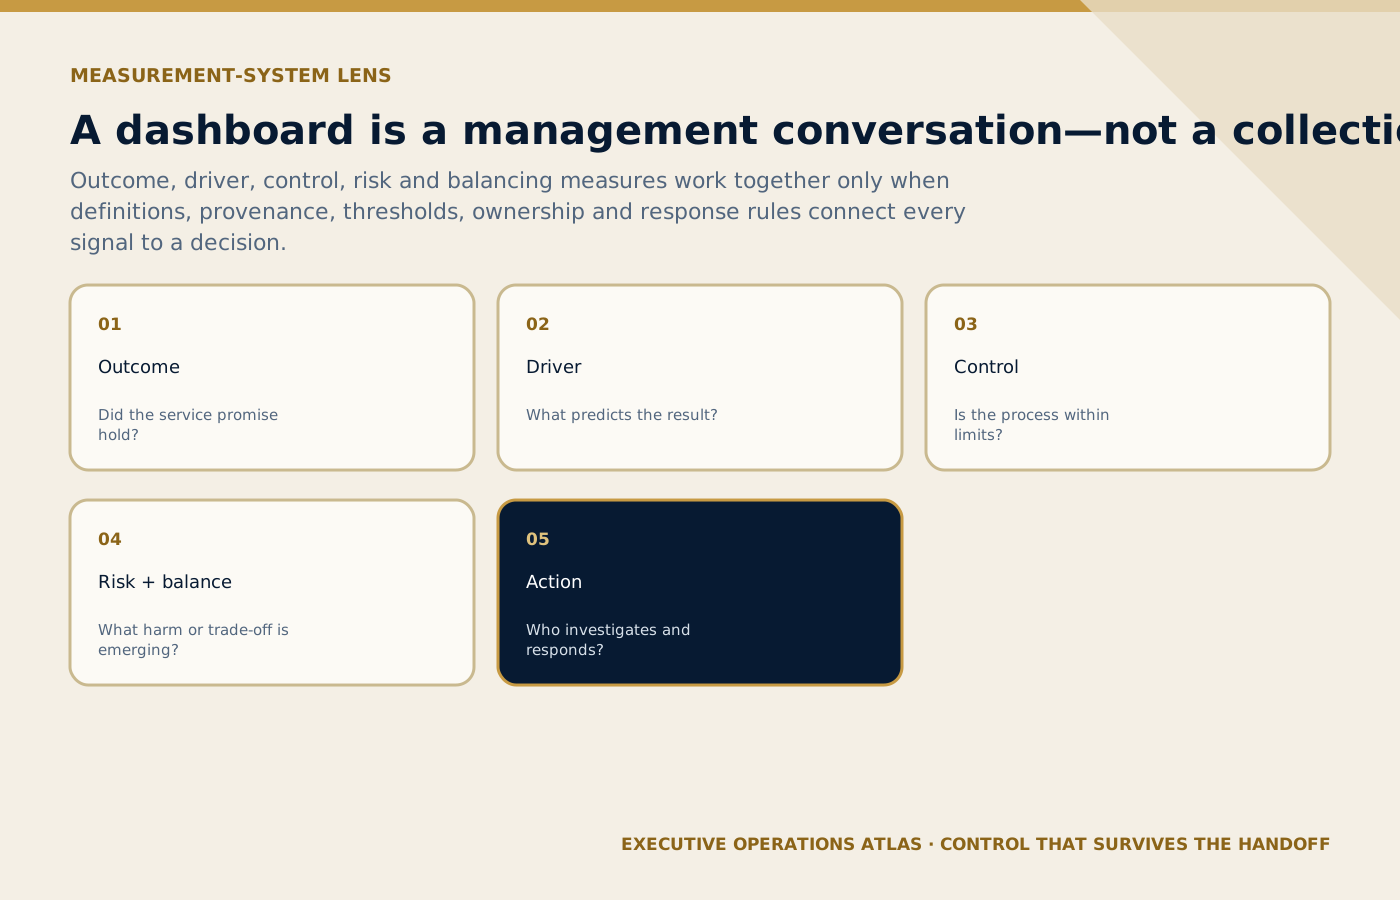
A balanced measure set becomes useful only when each signal is connected to context, investigation, ownership and response.
On small screens, scroll the diagram horizontally to read its labels.
#Concepts that must stay distinct
Measures, indicators, targets, and alerts are related but different. A measure records a quantity; an indicator interprets performance; a target states the desired level; an alert identifies a condition that requires attention. Blurring them produces dashboards with no decision logic. Leading indicators signal developing conditions such as unconfirmed resources, incomplete manifests, expiring documents, or workload imbalance. Lagging indicators describe results such as on-time performance, complaints, cost variance, and completed recovery. Managers need both. Control requires segmentation. An overall punctuality percentage can hide airport, hotel, supplier, vehicle class, shift, guide, or route variation. Drill-down should be planned around decisions and accountability, not added merely because the software permits it. More data does not guarantee better control. Privacy, data quality, timeliness, access, and interpretation matter. A small set of well-governed indicators with thresholds and owners will outperform dozens of orphaned metrics.
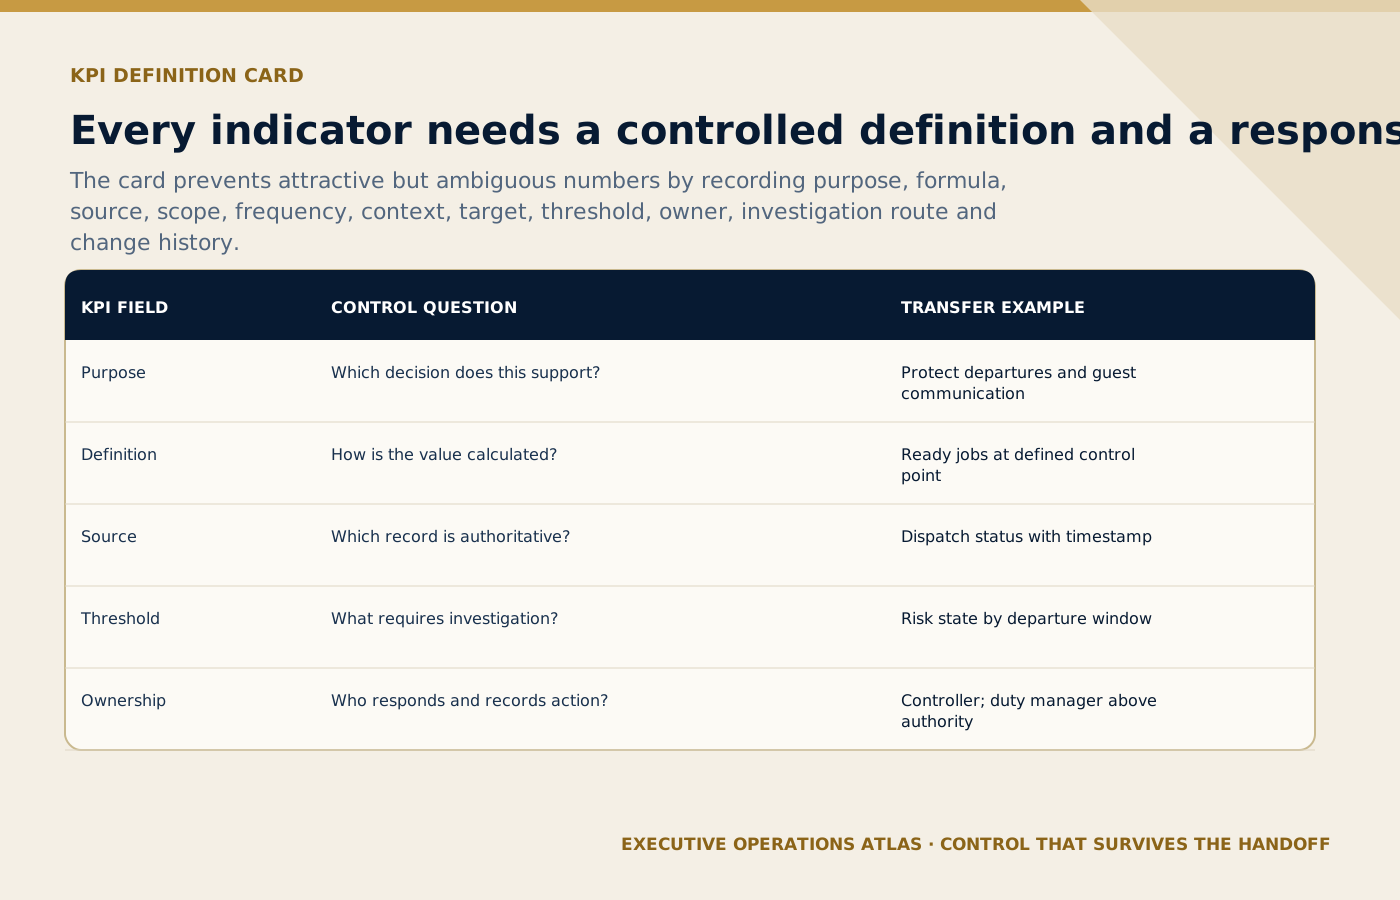
A controlled definition makes every indicator interpretable, traceable and actionable across managers, shifts and reporting periods.
On small screens, scroll the diagram horizontally to read its labels.
#Practical tool: KPI definition card and layered tourism operations control dashboard
Use the following canvas in a working session with a current process, representative service records, and the people who perform or receive the work. Mark assumptions and missing evidence openly; a blank or disputed answer is more useful than a confident invention.
| Element | Management question | Tourism application |
|---|---|---|
| Service outcome | Did the promised experience occur? | On-time pickup, correct service, completion, recovery outcome |
| Process health | Is the flow stable before failure? | Readiness, manifest completeness, acknowledgement, queue age |
| Guest and client | What did stakeholders experience? | Contactability, complaints, recovery acceptance, satisfaction trend |
| Risk and compliance | Are critical controls working? | Incidents, unauthorized changes, expired evidence, overdue actions |
| People and partners | Can the network perform reliably? | Competence, workload, supplier response, substitutions, recurrence |
| Financial and improvement | What is the cost and learning signal? | Variance, leakage, cost of failure, CAPA effectiveness, waste removed |
Scroll horizontally to read every column. Keyboard: focus the table, then use the arrow keys.
What to learn: Read each row across to connect Element with Management question, Tourism application. Compare the rows to identify the relevant element for your situation; use the accompanying section to interpret the result.
The canvas is intentionally compact. Its output should link to the controlled source—process map, risk register, requirement, data definition, SOP, system rule, supplier interface, training record, test, dashboard, audit, or improvement case. Copying detail into several places creates the appearance of completeness while weakening change control.
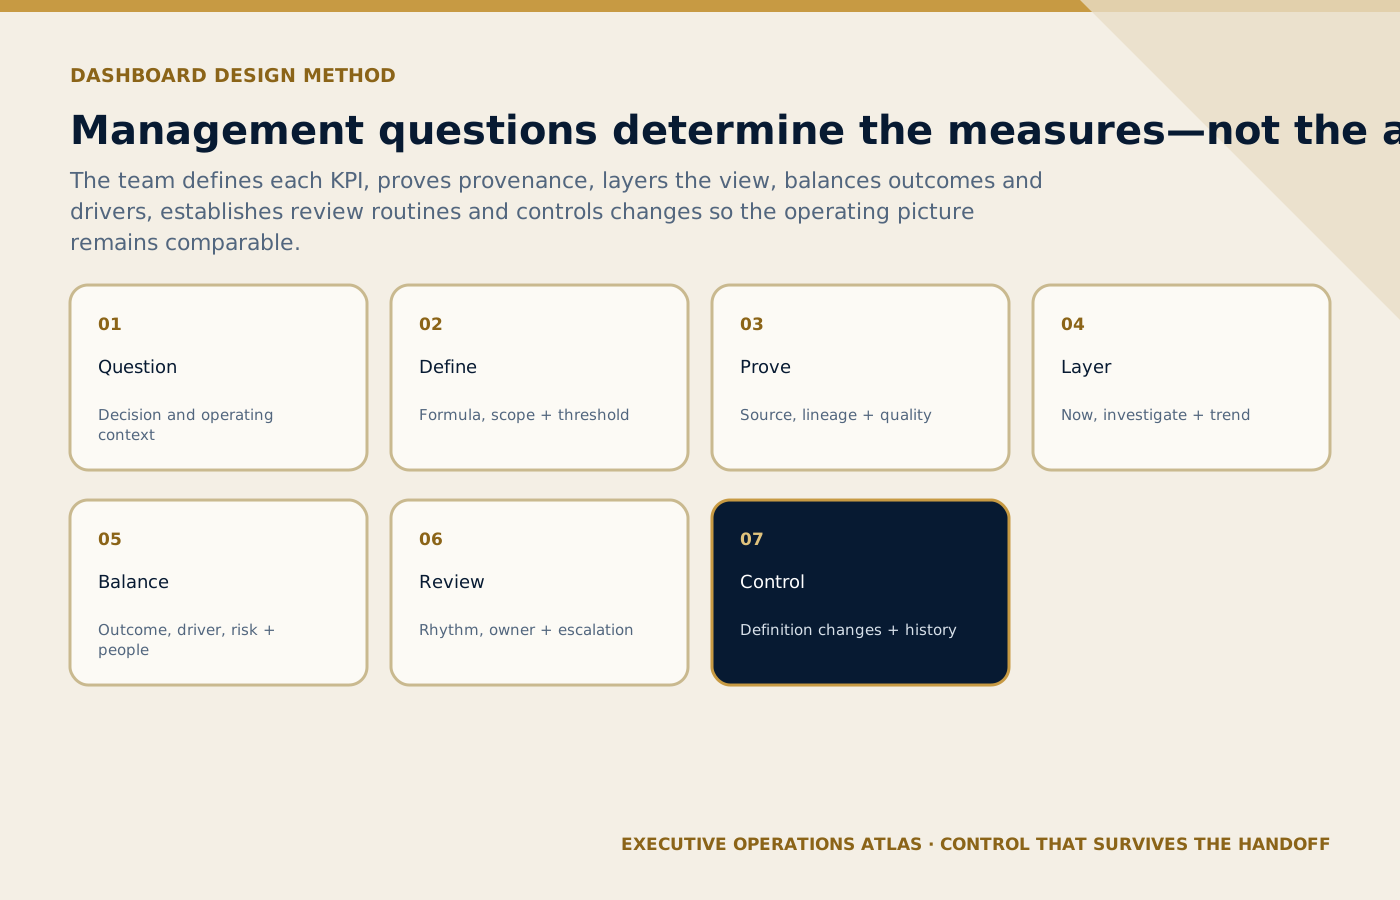
Management questions lead the design, while controlled definitions and review routines keep the operating picture comparable.
On small screens, scroll the diagram horizontally to read its labels.
#A professional method
#Start with management questions
Ask what the duty manager, department head, quality lead, and executive must decide at their different time horizons. Write those questions before selecting measures or buying dashboard features.
#Build a KPI definition card
For every indicator define purpose, formula, numerator, denominator, inclusions, exclusions, unit, source, owner, refresh, segmentation, target, thresholds, and required action.
#Establish data provenance
Trace each field from operational capture to transformation and display. Reconcile duplicate sources, late updates, manual overrides, time zones, and version changes before treating the number as evidence.
#Layer the dashboard
Create live control, daily operations, weekly process, and monthly management views. Each layer should contain only the detail and horizon needed by its audience, with a route to investigate exceptions.
#Balance the measure set
Pair speed with accuracy, efficiency with guest outcome, compliance with usability, supplier performance with service context, and improvement activity with verified effect. Watch for incentives that move failure elsewhere.
#Set review and escalation routines
Specify who reviews which dashboard, when, with whom, and what happens at red, amber, or abnormal-trend conditions. A threshold without an owner and response is decoration.
#Control changes to definitions
Version formulas, mappings, targets, and source changes. Recalculate or clearly mark breaks in trend so leaders do not compare unlike periods and draw confident but false conclusions.
At the end of the method, require a decision backed by evidence: proceed, proceed conditionally with named controls, return for correction, or stop. Record the decision maker, date, scope, residual issues, and next review. Ambiguous approval is especially dangerous in tourism because live teams and partners will fill the gap differently under time pressure.
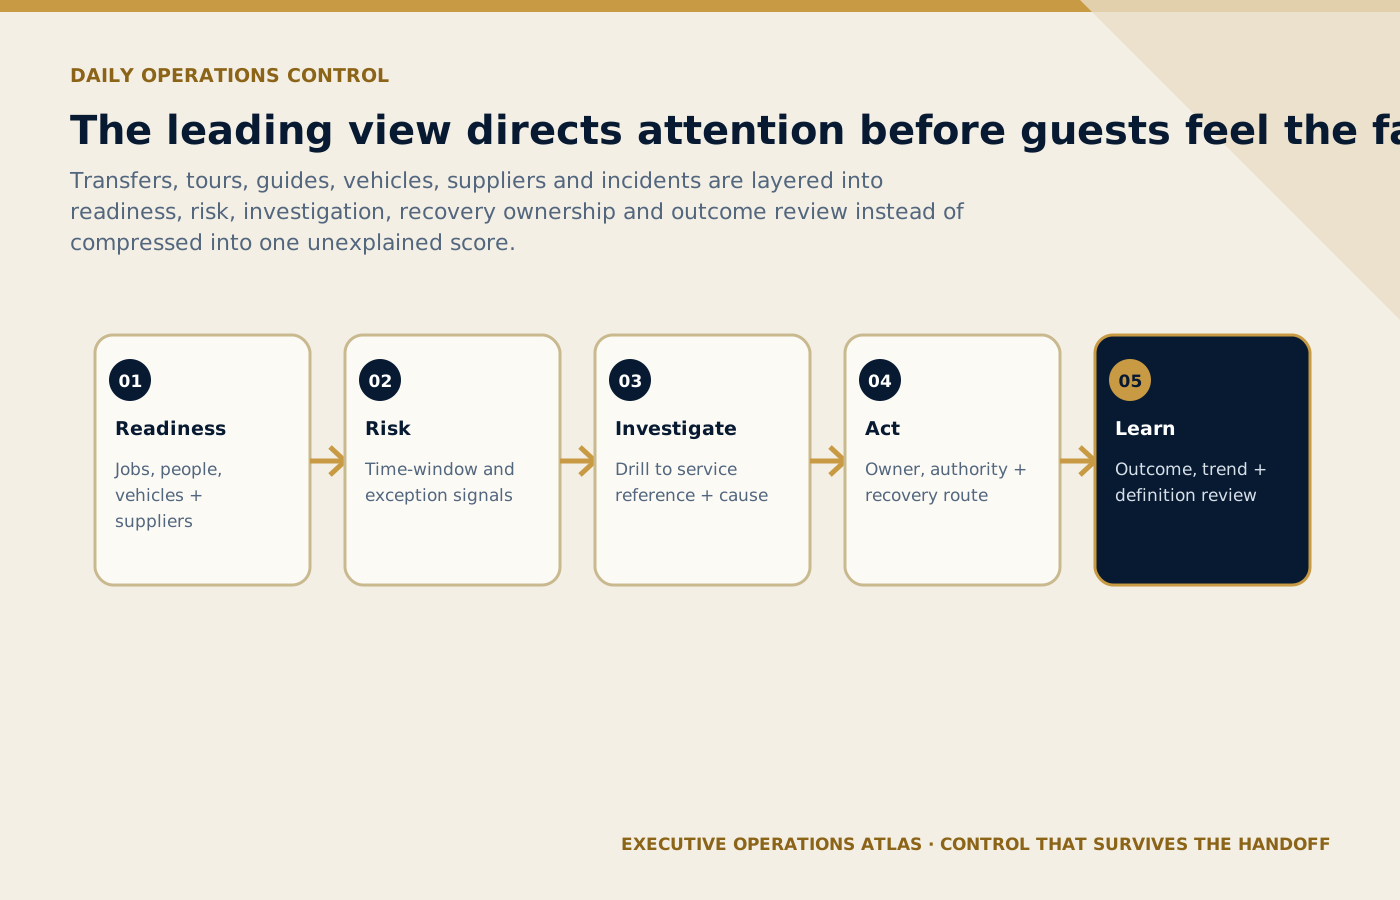
Leading signals direct attention before guest impact, and layered detail carries the manager from risk to an owned recovery action.
On small screens, scroll the diagram horizontally to read its labels.
#Example: A daily tourism operations control view
Illustrative scenario
Operational teaching scenario, not a documented incident. Uncited figures and outcomes are illustrative assumptions.
- Situation
Apply the a daily tourism operations control view using the assumptions described in this example.
- Evidence
Check metric definitions, source records, reporting periods, thresholds, weights and the owner responsible for each signal.
- Decision
Decide which verified exception needs intervention and which apparent trend requires a data-quality check first.
- Action
#Initial request
Leadership asks for a single on-time-performance number. The dashboard team first separates airport arrivals, hotel departures, tours, and intercity services because the triggers and tolerances differ.
#Leading view
The live screen shows unacknowledged assignments, services inside the readiness window, missing guest contacts, supplier non-response, workload by controller, and active recovery cases.
#Investigation
A green overall punctuality result hides a recurring evening supplier delay. Segmentation by time and supplier exposes the pattern and routes it to root cause analysis rather than congratulation.
#Governance
The team documents a revised readiness definition after a system change, preserves the effective date, annotates the trend break, and verifies that the new formula matches the operational question.
The example is not a universal SOP. A company should repeat the reasoning with its own service promise, systems, suppliers, volumes, guest profiles, legal environment, and disrupted conditions. Compare the design with operational risk assessment and customer-journey mapping for SOP design so operational control, risk, and the visible guest journey remain connected.
#Common failure modes—and the management response
- Choosing measures because data is easy to extract. Trace the operational consequence using a recent case, then identify the earliest control that could have prevented, detected, or safely contained the condition.
- Publishing formulas no one owns. Follow the issue across upstream inputs and downstream handoffs. The visible lapse may originate in workload, information, authority, system design, supplier behavior, or an incentive outside the user's control.
- Using averages that hide operational tails. Decide whether the remedy belongs in process design, the SOP pack, technology, resource planning, supplier governance, competence, or leadership policy. Adding prose to the wrong document will not control the cause.
- Setting targets without response rules. Test the proposed remedy in a normal case and a credible exception. Confirm that improvement in one measure has not transferred delay, risk, cost, or confusion to another role or the guest.
- Rewarding speed while quality deteriorates. Assign one accountable owner, evidence, due date, and review point. An informal workaround may protect today's service but should not silently become the future operating method.
- Changing definitions without marking the trend break. Record the residual risk and escalate it through the approved route. A vague warning such as ‘take care’ is not an observable control and cannot support an effectiveness decision.
- Verification
#Outcome view
The daily review adds pickup and completion performance, incorrect-service defects, guest contact outcomes, complaints, recovery time, records completeness, and cost variance.
Reconcile the measure with its source and confirm whether the action changed the operating condition, not merely the displayed score.
#Implementation roadmap
Implementation should be proportionate to risk and change. The same five gates can govern a small improvement or a cross-company launch, but the evidence, independence, resources, testing, and approval depth should match the potential consequence.
#Phase 1: Mandate
Confirm sponsor or owner, scope, authority, success criteria, affected stakeholders, risk, resources, and the evidence required before proceeding. Put unresolved assumptions in an issue log rather than disguising them as approved facts.
#Phase 2: Design
Use observed work, representative records, customer and partner needs, data, risk, and front-line knowledge. Align the method with process maps, SOPs, systems, contracts, supporting tools, roles, and existing governance.
#Phase 3: Pilot
Choose representative normal, boundary, and exception cases. Protect live operations, define acceptance and stop criteria in advance, record actual results, correct defects through control, and retest affected interfaces.
#Phase 4: Release
Verify approved content, access, system readiness, partner acknowledgement, competent users, supervisor coverage, communications, rollback or contingency, monitoring, support, and explicit go-live authority.
#Phase 5: Sustain
Review early use, compare results with baseline, audit deployment and effectiveness, route recurrence through RCA and CAPA, preserve lessons, and control revisions so improvement does not create parallel versions.
Control the approved version through document control and version management. Use training, competency, and SOP adoption to verify competence and adoption rather than counting distribution or attendance. Where suppliers perform part of the process, apply the interface and performance disciplines in supplier and partner governance.
#Measures that support decisions
Select a small balanced set. For each measure define purpose, formula or classification rule, numerator and denominator where applicable, source, owner, refresh, segmentation, target, response threshold, and known limitations. A measure without an action route becomes reporting overhead.
| Measure | Decision use |
|---|---|
| Kpi definition cards approved and current | Shows whether the method is deployed, producing its intended result, exposing risk early, or requiring investigation and controlled improvement |
| Dashboard fields passing data-quality checks | Shows whether the method is deployed, producing its intended result, exposing risk early, or requiring investigation and controlled improvement |
| Alerts acknowledged within threshold | Shows whether the method is deployed, producing its intended result, exposing risk early, or requiring investigation and controlled improvement |
| Red conditions with recorded action | Shows whether the method is deployed, producing its intended result, exposing risk early, or requiring investigation and controlled improvement |
| Repeat exceptions after review | Shows whether the method is deployed, producing its intended result, exposing risk early, or requiring investigation and controlled improvement |
| Management decisions traceable to verified evidence | Shows whether the method is deployed, producing its intended result, exposing risk early, or requiring investigation and controlled improvement |
Scroll horizontally to read every column. Keyboard: focus the table, then use the arrow keys.
What to learn: Read each row across to connect Measure with Decision use. Compare the rows to identify the relevant measure for your situation; use the accompanying section to interpret the result.
Read the measures together. A better average can hide a damaging tail; a lower complaint count can reflect harder reporting; a perfect checklist score can coexist with weak outcomes; and a rise in recorded exceptions may be healthy when previously hidden problems become visible. Segment results and combine performance data with observation, audit, guest evidence, supplier context, and front-line feedback.
#Field review before approval
#Value and outcome
Can the team state which guest, client, employee, partner, or organizational outcome this method protects, and what evidence would show that value was actually created? Review one successful and one failed service so internal completion is not confused with customer value.
#Boundary and ownership
Are trigger, completion, exclusions, process owner, deputies, and connected services explicit? Follow one service reference end to end and note every point where work crosses a department, system, shift, location, or supplier boundary.
#Risk and resilience
Have credible failure, peak demand, absence, conflicting information, technology loss, supplier failure, accessibility need, and recovery been examined proportionately? Confirm that efficiency does not remove the capacity or discretion needed to stabilize a disrupted service.
#Data and evidence
Are definitions, sources, timestamps, versions, calculations, access, corrections, and retention controlled enough to support the stated decision? Reconstruct an event from records and identify any conclusion that depends on memory, a private message, or an unverified field.
#People and authority
Can representative users explain and demonstrate their role, decision limits, handoffs, and escalation under real working conditions? Include night, weekend, remote, temporary, and partner personnel where they form part of the service.
#Guest and partner interface
Does the design control what external parties need to know, provide, acknowledge, decide, and record without exposing them to contradictory instructions? Walk through the visible guest experience and ask a partner to demonstrate the handoff in their own words.
#Usability and technology
Can the method be used on actual devices, channels, locations, languages, and workload conditions without unofficial notes or coaching? Observe searching, scrolling, duplicate entry, screenshots, manual workarounds, and automation failure as evidence about design.
#Learning and governance
Will incidents, complaints, defects, tests, audits, measures, user feedback, supplier signals, and external change reach a named review and controlled decision? Distinguish urgent correction, formal CAPA, routine revision, project change, and strategic improvement.
#How this article connects to the series
The most useful connected articles are SOP auditing, root cause analysis, the operational excellence management system. Each supplies a prerequisite, complementary control, or next improvement step; the links form a deliberate route through the series rather than promotional references added after drafting. The existing portfolio demonstrates the operating context in The Fleet Control Tower, Tour Guide Quality Index, The Abu Dhabi MICE Movement Control Room. Those pieces show journeys, assignments, control rooms, dashboards, guide quality, AI tools, commercial workflows, or recovery in practice. This article adds the management method behind repeatable delivery.
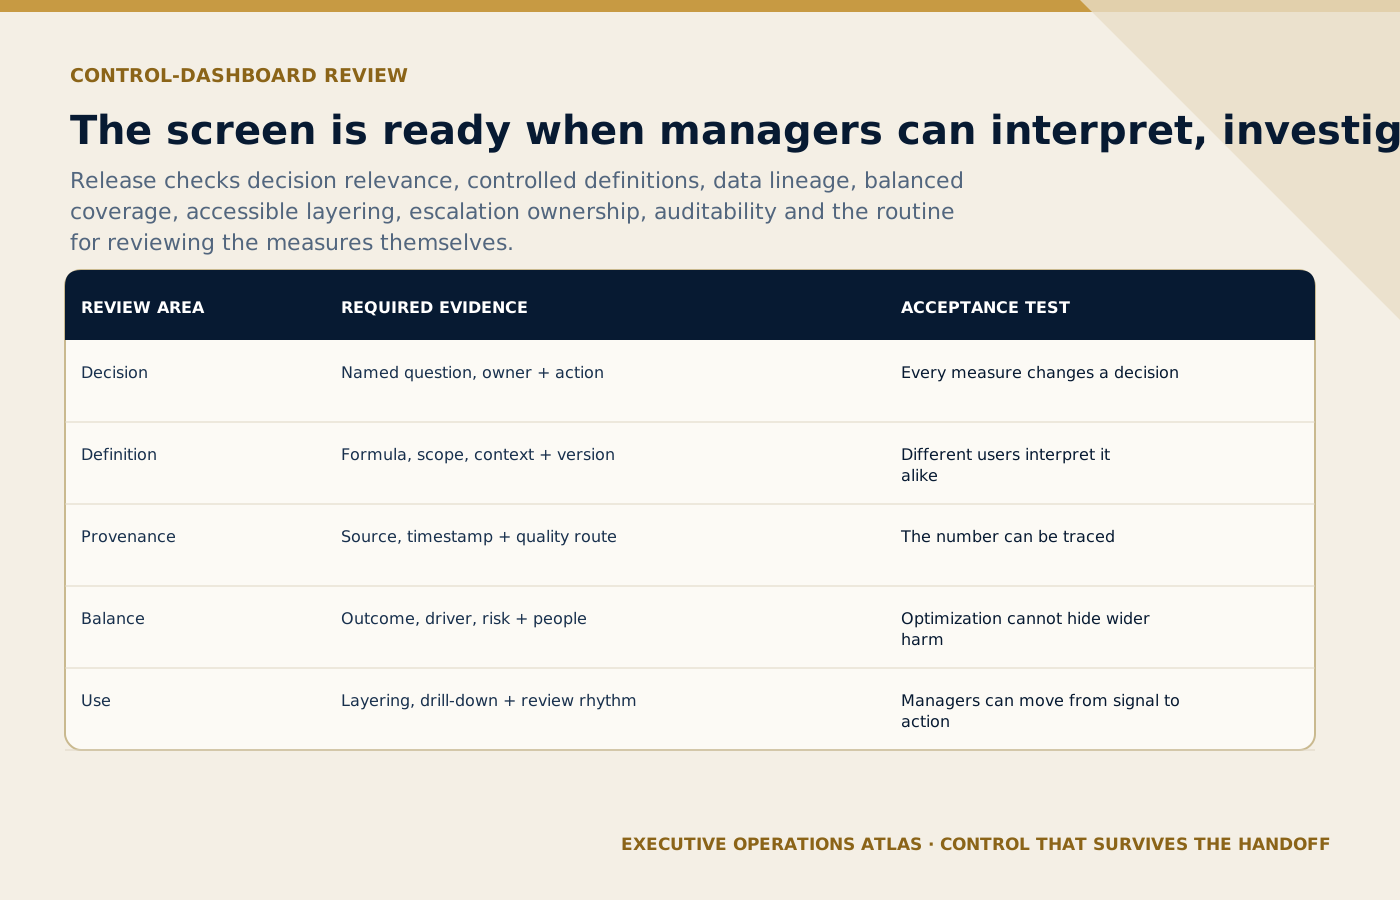
Release depends on whether managers can interpret, investigate and act—not on how many charts fit on the screen.
On small screens, scroll the diagram horizontally to read its labels.
#Manager's approval checklist
- The purpose, service value, scope, owner, users, authority, and required outcome are explicit.
- The method reflects observed work, current systems, representative data, guest needs, partners, risk, and disrupted conditions.
- Definitions, roles, thresholds, evidence, privacy, accessibility, safety, exceptions, and escalation are controlled at the appropriate level.
- Supporting documents, systems, tools, contracts, training, tests, dashboards, and records agree with one another.
- Representative users and partners have demonstrated the design in normal and exception scenarios without hidden coaching.
- Release, access, version, support, monitoring, audit, change, retention, improvement, and withdrawal arrangements are ready.
#Sources and further reading
Primary standards, institutional guidance and professional references used to support this article.
- NIST — measurement, analysis, and knowledge management
- NIST — Baldrige Performance Excellence Program
- UN Tourism — Statistical Framework for Measuring the Sustainability of Tourism
- ISO 9004:2018 — guidance for sustained organizational success
- ISO 23592:2021 — principles and model for service excellence
Editorial note: This article provides operational and quality-management guidance for a professional portfolio. It does not provide legal, regulatory, privacy, safety, emergency, employment, financial, or contractual advice, nor does it replace official framework training or certification materials. Apply qualified local review wherever those obligations affect the service.
Connect this guide to your next step
Continue with related methods and the wider series.
- Related guideSix Sigma for Tourism: From Complaints to Data
Translate recurring guest complaints into operational definitions, reliable measures, verified causes, controlled improvements, and sustained performance through DMAIC.
- Related guideFrom SOP Library to Tourism Operational Excellence Management System
Transform a collection of controlled documents into an integrated system that aligns value, governance, capability, execution, evidence, measurement, learning, and sustained service excellence.
- Related guideHow to Create Standard Test Procedures (STPs) for Tourism Operations
Write repeatable operational tests with controlled preconditions, unambiguous steps, expected results, evidence, defect handling, and accountable release decisions.
Put this article into practice
- Design balanced measures with definitions, sources, owners and review rules that lead to operating decisions.
- The purpose, service value, scope, owner, users, authority, and required outcome are explicit.
- The method reflects observed work, current systems, representative data, guest needs, partners, risk, and disrupted conditions.
- Definitions, roles, thresholds, evidence, privacy, accessibility, safety, exceptions, and escalation are controlled at the appropriate level.
Your next step
Use this connected method when you are ready to build a CAPA workflow that separates containment, verified cause, corrective action and effectiveness checks.
Review CAPA: Corrective and Preventive Action in Tourism